Value
Retailers using DecisionNext for ad planning procurement boost their profit margins by 6% on average. They also cut the time it takes to set up ads by 30%.
Problem
Your team misses out on critical margin when setting the weekly ad plan. Especially if they don’t have the right tools to map out the best procurement strategy. Here are some common challenges:
- Most retailers default to the previous year’s weekly ad plan
- They’re unable to assess whether running the same feature item as last year will result in profitability
- Most meat buyers have no way to evaluate ad procurement performance based on future market conditions
- Ad planning spreadsheets are large, require constant updating, and are susceptible to errors
Solution
This single AI-assisted platform can be accessed right from your desktop. It’s what your team needs to optimize your ad planning and purchase. It enables you to:
- Get a comprehensive view of forecasted ad procurement performance 26 weeks out by item/feature and by week
- See forecasts automatically updated with live data going out 26 weeks
- Identify underperforming features based on forecasted cost far enough in advance to make corrections
- Gain insight on item replacement suggestions based on supply and/or price
About DecisionNext
DecisionNext is a best-in-class AI platform that empowers companies to buy or sell at the best times, with the best formulas, at the best prices. Built in collaboration with our customers, DecisionNext has revolutionized how price and supply forecasting can improve business decisions. And it’s the only platform that incorporates users’ wisdom in its algorithms! Our case studies illustrate real-world examples of how our platform has helped customers. Please reach out with questions or for a deeper dive into our solutions.
The Scenario
A meat and seafood team is looking ahead 12 weeks to set their ad plan. In this situation, most retailers use the previous year’s ad plan as a baseline with the goal of beating last year’s ad performance.
But it’s not last year anymore. It’s this year. The fundamentals of the markets are significantly different, and the procurement landscape has completely changed.
What you need is a way to quickly assess ad performance based on the current forecast of future market conditions.
Don’t Reinvent the Wheel
Start off by using last year’s ad as the foundation. Your team is doing some version of copying the master spreadsheet used to organize ad features into a new spreadsheet for this year. Then your experts go in and conduct an ad hoc comparison.
With the DecisionNext platform, the weekly dance of copying over last year’s ad plan only has to be done once (Fig. 1). Then the system will automatically remember—and update—any edits you make.
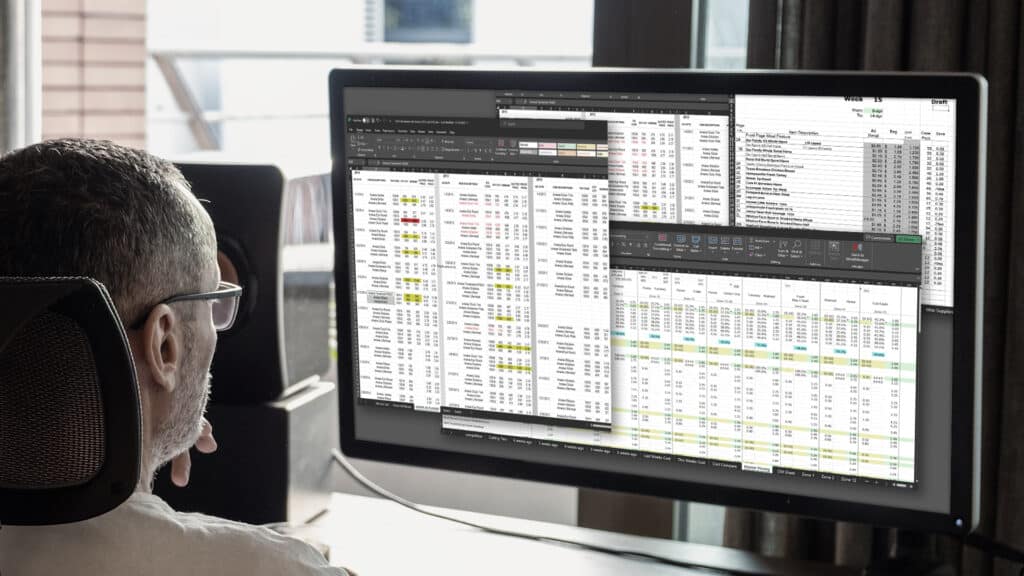
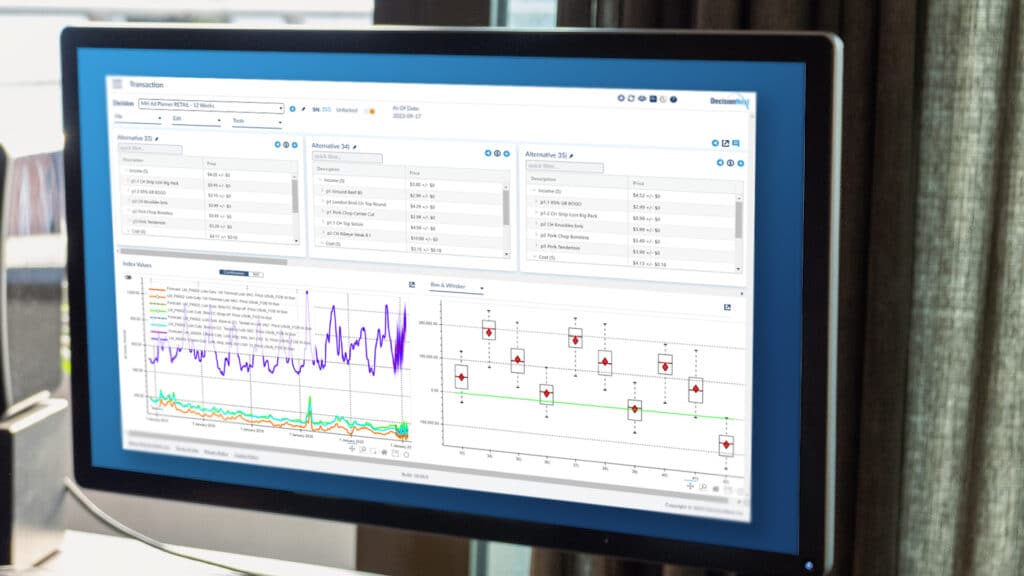
Figure 1 – Replace hero spreadsheets that need to be maintained manually with a single platform that updates automatically.
Gone are the days of relying on random spreadsheet comparisons and past data for procurement decisions. With the DecisionNext platform, you can now calculate expected profits using real-time forecasts, assess risks for different ad features, and much more. Plus, you can build out your weekly ad plan for up to 26 weeks, including fresh and processed feature items (Fig. 2).
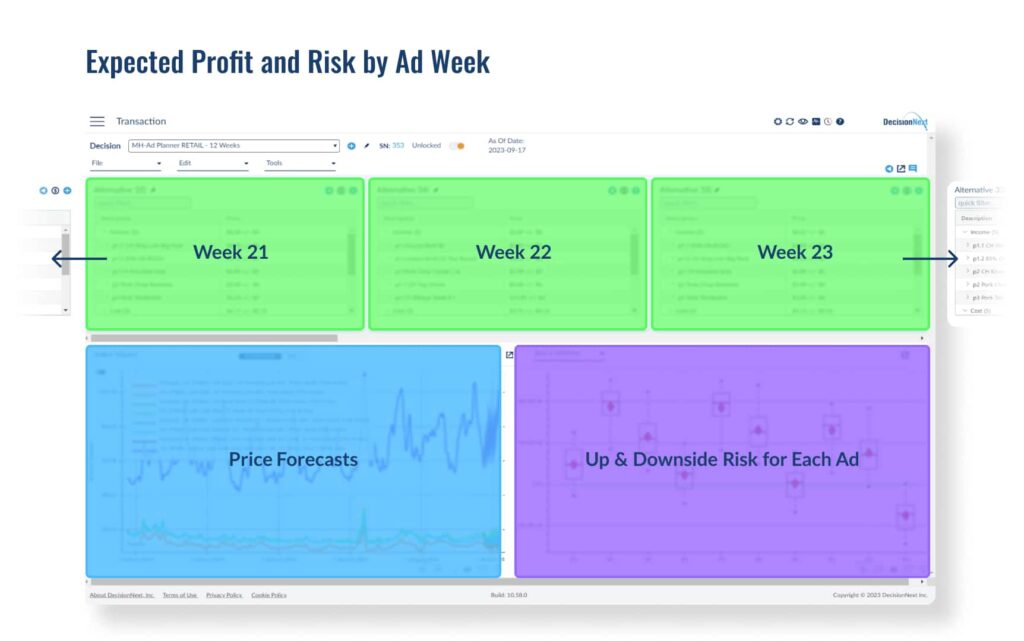
Figure 2 – Diagram of DecisionNext Platform Interface with All Ad Weeks in One Place.
Compare Substitute Feature Items for Sales and Margin
Think about your current ad setting process. Do you have a way of calculating expected margins? What do you do when the expected margin doesn’t meet targets?
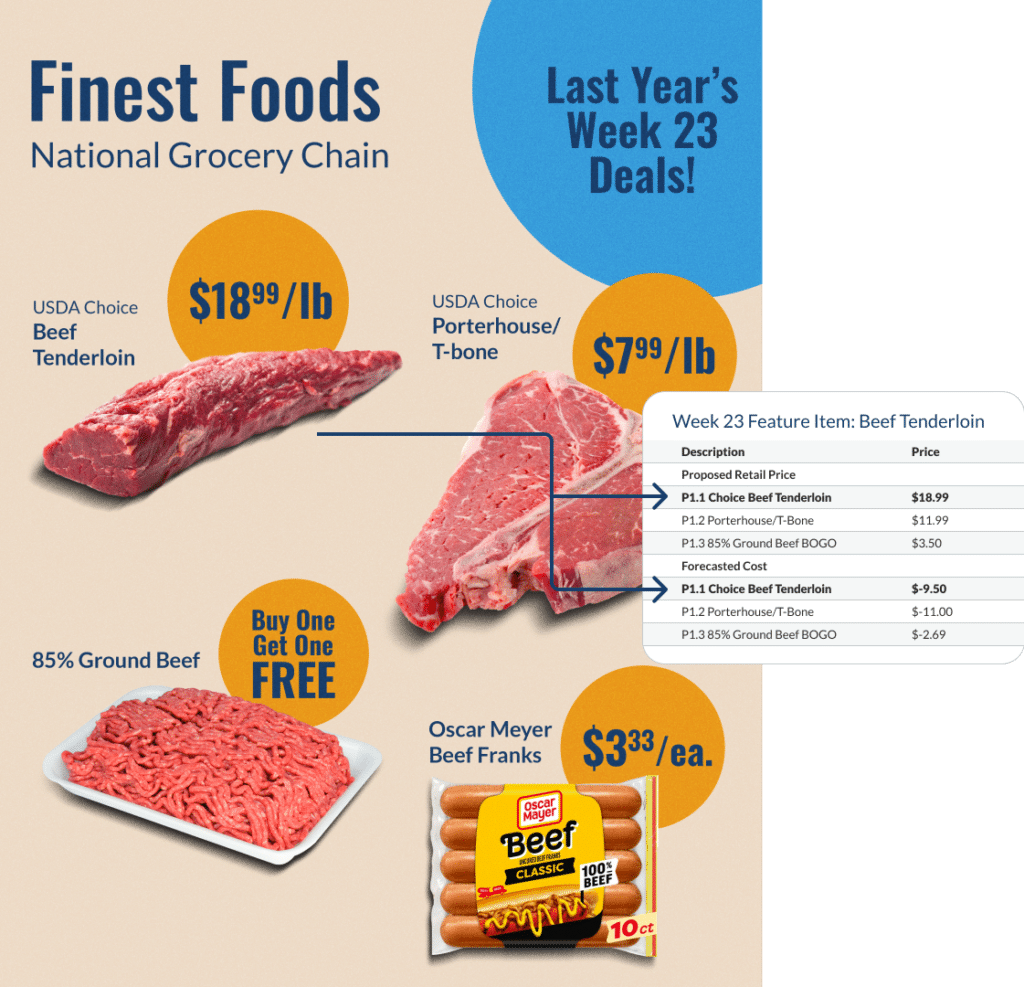
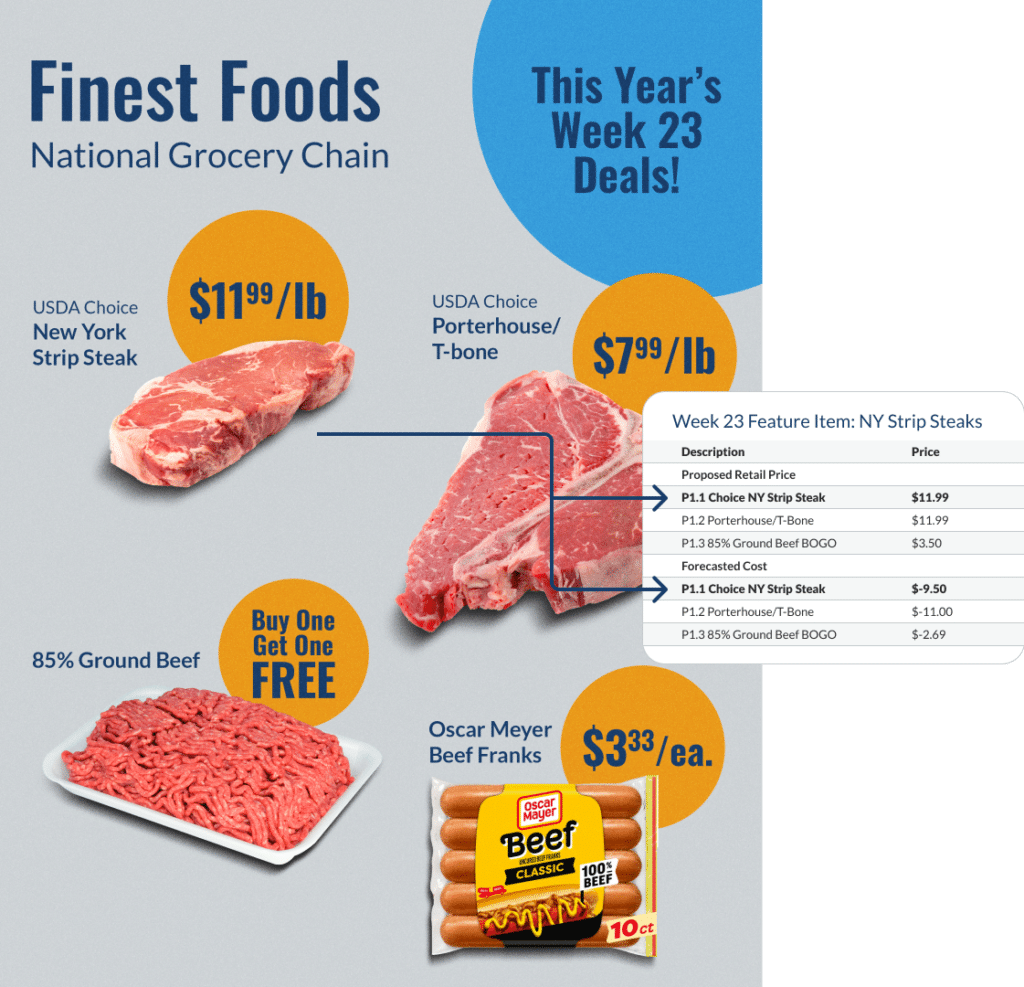
Figure 3 – Mock Ads Demonstrate Income and Cost Line Items Comparing Last Year’s Week 23 Deal with an Alternative for This Year (Beef Tenderloins vs. NY Strip Steaks).
Consider this example: In week 23 of last year, you ran beef tenderloins as the primary feature (Fig. 3). And it proved to be successful, meeting both sales and margin targets. We can use this as the baseline for the week 23 ad this year. But the tenderloin market is behaving differently this year than it was last year.
Unlike your static spreadsheet, the DecisionNext system will use best-in-class forecasting to calculate the best way to get this bought, and calculate both the up and downside risks . Using this forecast, it’s clear that running tenderloins just like last year is not going to meet your sales and margin targets in week 23 (Fig. 4).
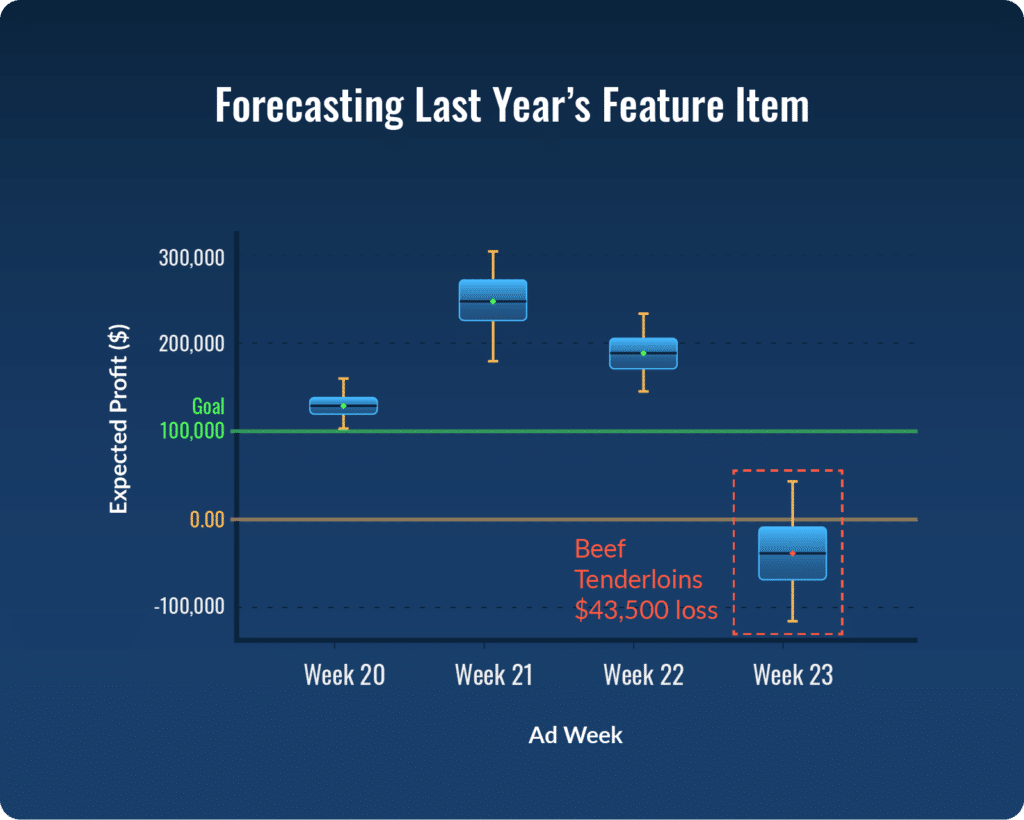
Figure 4 – Forecasting Last Year’s Feature Item.
You know what items you can substitute for beef tenderloins, but you don’t know which would be more profitable. Given what you have been seeing in the market, you have a hunch that it could be more profitable to run strips as the main feature for week 23.
With the DecisionNext platform, you can easily run this comparison between tenderloins and strips to calculate which lead feature item will yield a higher margin.
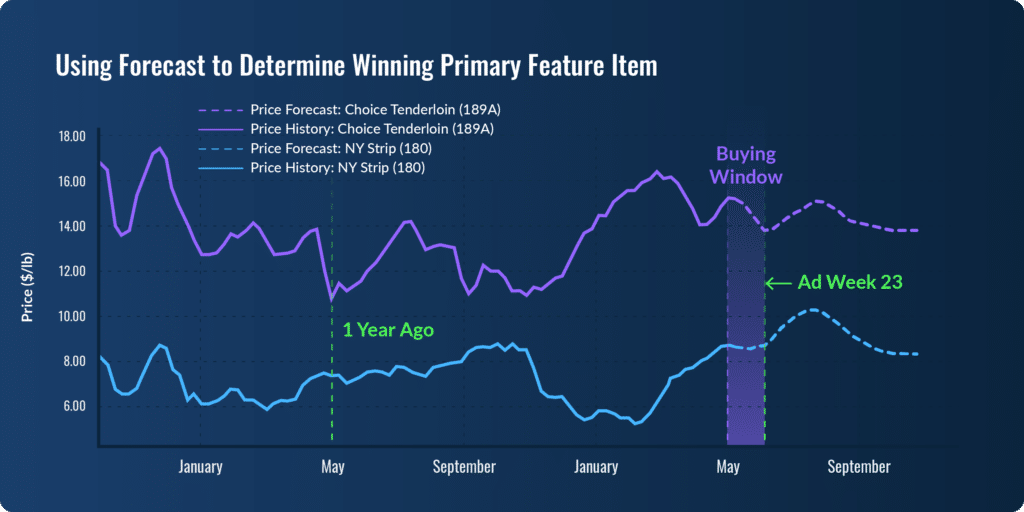
Figure 5 – Using Price Forecast to Determine Winning Primary Feature Item.
As you can see from the graph (Fig. 5), strips are a better value than tenderloins at this time.
By using the DecisionNext platform, you can optimize the entire ad plan up to 26 weeks into the future with just a couple clicks.
And the results are clear: substituting strips for tenderloins will result in a winning ad for week 23. Running strips at $8.49 will allow you to comfortably meet your ad revenue goal for week 23.
Run Your Ad Before You Run Your Ad
In this example (Fig. 6), we tested a single feature substitution for one week’s ad. Now imagine being able to perform these calculations 26 weeks into the future, automatically re-evaluating on a weekly basis—all with a couple clicks from a single screen.
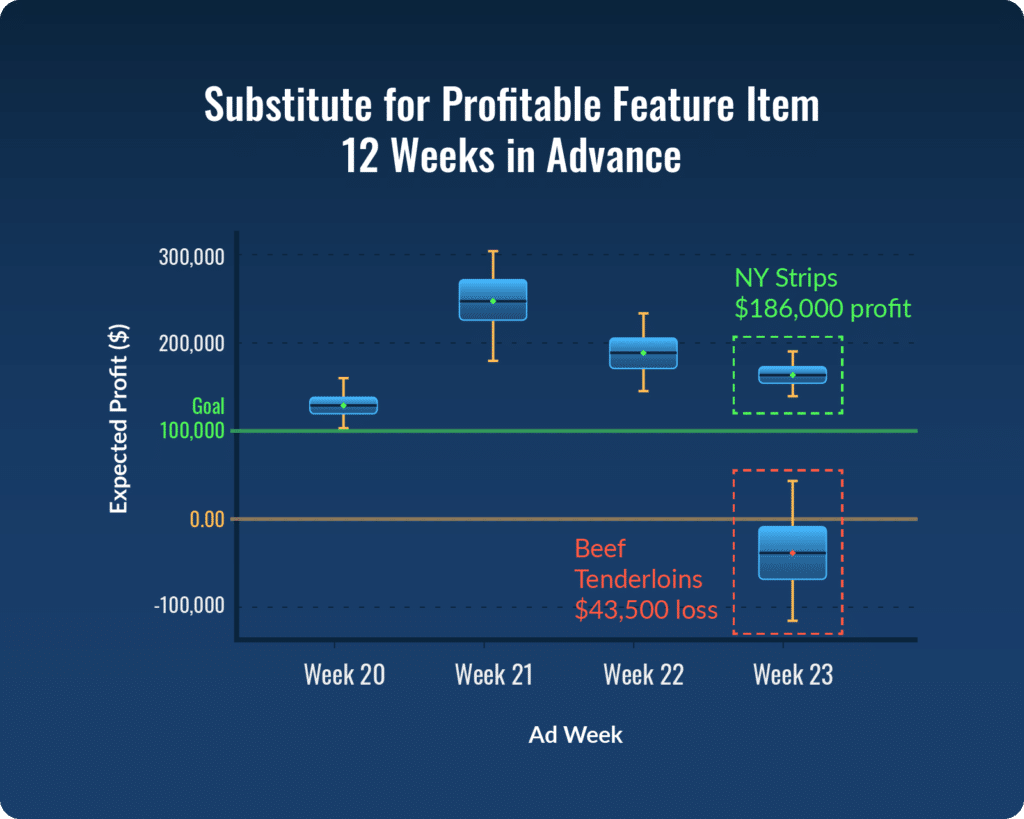
Figure 6 – Box & Whiskers Plot Forecasted Profitability (NY Strip) Compared to Last Year’s Feature (Beef Tenderloins).
Want to share this Case Study?
Copy and paste the URL or download a PDF to send to your colleagues!
![]()

