Value
With DecisionNext, a large iron ore producer increased profits by an average 6-8% on spot sales. Our solution helped them optimize pricing strategy and reduce the time required to make key decisions.
Problem
- Without accurate forecasts, producers are forced to rely on historical averages, futures markets (if available) and experience to price goods
- Understanding the potential upside and downside risk profiles of multiple selling opportunities is complex and time consuming
- Many iron ore producers don’t have the time to do a proper analysis resulting in suboptimal decisions
- Companies are leaving millions of dollars on the table because they aren’t equipped to make the most out of the timing of their sales strategy
Solution
- You need an accurate and defensible short and long term forecast to optimize sales planning strategy
- You’re enabled to rapidly assess multiple sales strategies side by side to best mitigate risk
- You can better streamline decision making and cost-effective planning
About DecisionNext
DecisionNext is a best-in-class AI platform that empowers companies to buy or sell at the best times, with the best formulas, at the best prices. Built in collaboration with our customers, DecisionNext has revolutionized how price and supply forecasting can improve business decisions. And it’s the only platform that incorporates users’ wisdom in its algorithms. Our case studies illustrate real-world examples of how our platform has helped customers. Please reach out with questions or for a deeper dive into our solutions.
The Scenario
A producer with 250kt of Iron Ore is looking to identify the most opportune time window for selling to maximize profitability. They’re planning to sell based on the spot average of the July–August window (Fig. 1, Alternative 1).
But are historical trends, futures boards, and gut instincts the best tools to formulate a strategy? Are you confident that your team has the right tools to be able to effectively select at the most profitable sales window?
They need a better way to compare deal structure alternatives of their 250kt iron ore shipment.
In this case, the producer can select one of three alternatives:
- June–August — Sell at average Platts Index price of June ‘23 over a three month quotation period
- September–November — Sell at average Platts Index price of September ‘23 over a three month quotation period with 10% premium
- June–November — Sell at average Platts Index price of June ‘23 over a six month quotation period
The DecisionNext Transaction Application allows the buyer to rapidly evaluate the risk associated with each alternative buying strategy (Fig. 1). In all three scenarios, the pricing strategy is set to sell the ore at the average Platts Index for a given time window.
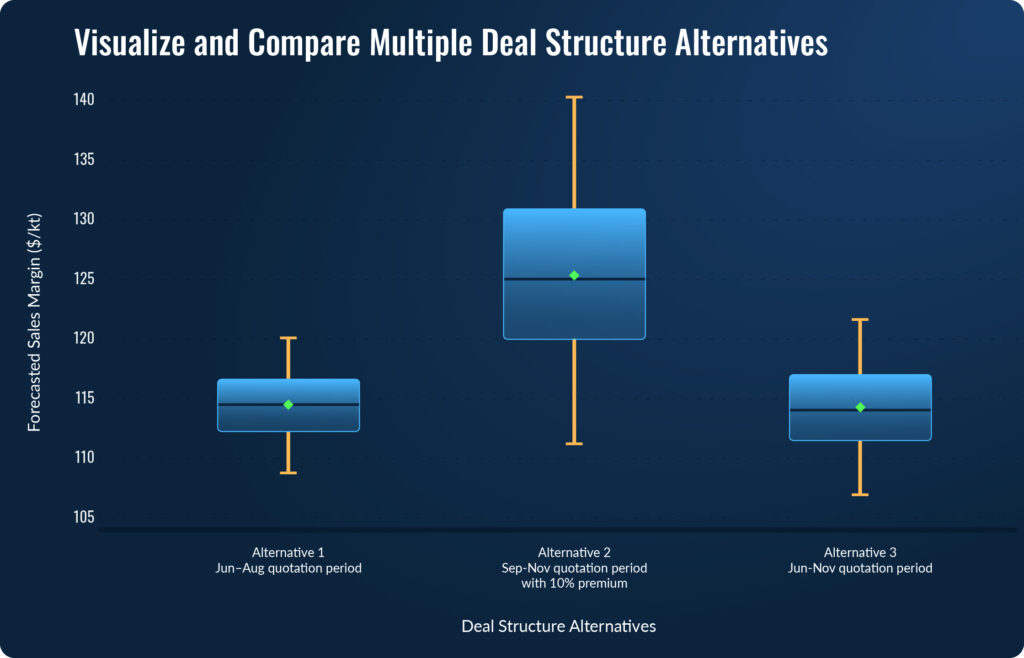
Figure 1 – Box & Whiskers plot graphically comparing three potential sales time windows to evaluate the risk associated with each sales strategy.
This type of plot provides a reference point for scorecarding market buys. And it simultaneously empowers and trains buyers to make better decisions in the future.
Quick takeaways from the three alternatives (Fig. 1):
- Alternative 1 shows the average sales price forecast is around $115/kt. The short whiskers indicate a tight risk profile, with 90% of the simulated outcomes falling between $109 – $120 / kt.
- Alternative 3 is very similar to alternative 1, with a slightly lower average sales price forecast and a slightly wider risk profile, both upside and downside.
- In contrast with the others, Alternative 2 has an average sales price forecast of $125/kt. And note that the bottom of the box is roughly even with top of the whiskers for Alternatives 1 & 3, meaning that roughly 75% of the simulations indicated fall above the highest upside forecast for either of the other two scenarios.
After reviewing the forecasted risk profiles for the three different sales windows provided, it is clear that Alternative 2 is the most likely to maximize profits on the shipment. Armed with this information, the iron ore producer changed their sales strategy to sell in September–November with the 10% premium.
An Ironclad Way to Eliminate the Guesswork
Now imagine if you could “lock” a forecast at the date of the decision, allowing your team to compare that forecast to what actually happens in the market and giving you a reference point to scorecard sales decisions (Fig. 2). This is exactly what DecisionNext empowers users to do, simultaneously empowering and training traders to make better decisions in the future.
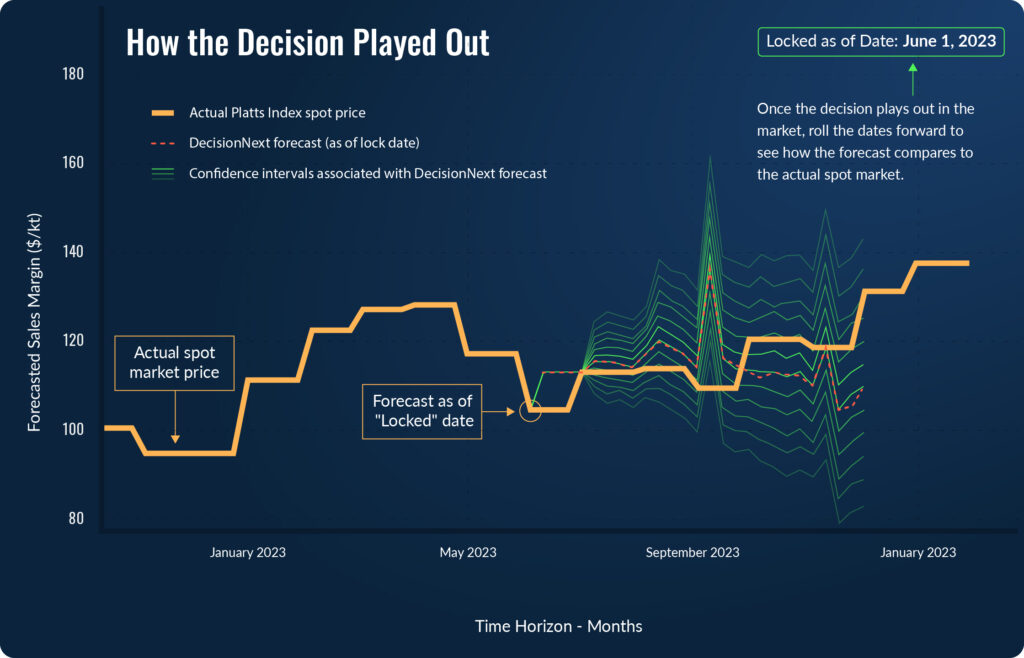
Figure 2 – Time Series plot demonstrates how you can use the DecisionNext tool to “lock” forecasts at the date of the decision. You can then compare the forecasted outcomes to what actually happened to see how you performed given the information you had at the time.
Outcome
Figure 3 shows the DecisionNext forecast (the box and whiskers plot which should look familiar from Fig. 1) compared to the actual outcome of those three deal structures given the movement of the Platts Index in 2023.
As you can see, the iron ore producer made the right decision – the market average for September–November yielded a profit of $129/kt, $19/kt more than they would have profited in June–August. Best-in-class forecasting combined with AI-assisted decision simulation tools gave this producer the confidence to wait to sell until the September-November window, resulting in a 7% increase in profit.
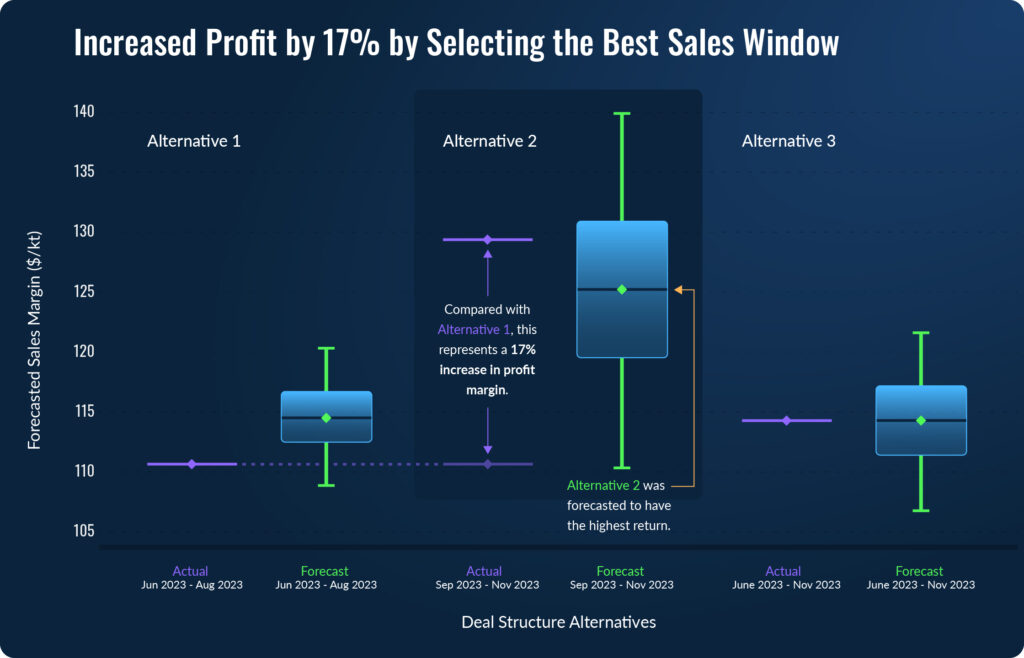
Figure 3 – Box & Whiskers comparing the three decision alternatives where the box and whisker shows the original projection in blue on the date of the decision and the red lines show what actually happened in the market.
DecisionNext Value Adds in Mining
- Maximize Revenue by Product Blend
- Spot vs Fixed Pricing: Discount/Premium
- Geographic Arbitrage
- Product Arbitrage
- Augment Formula Program with Spot Sales
- Fixed Shipping Optimization
- Mine Blending Optimization
- Marginal Cost to Produce
- Shut Scheduling
Helpful Definitions:
Box & Whiskers Plot: Quantifies the expected value and risk of a given alternative based on hundreds of thousands of simulations for the forecasted commodities. The red line represents the mean expected value, the box represents where 50% of the simulations fell, the whiskers represent 90% of the simulations. The wider the whiskers, the more uncertainty or risk there is a decision.
Want to share this Case Study?
Copy and paste the URL or download a PDF to send to your colleagues!
![]()

