A New Lens on Finished Goods Economics
Today, the re-release of our new and improved DecisionNext Finished Goods Index is live—and it’s here to change the game. Featuring updated methodology, historical data going back to 2010, and a six-month forecast for both the finished goods price and index value, the tool is even more powerful and built to help turn market volatility into measurable gains.
The question is: Why bring it back now?
It’s simple. Across the food value chain, teams are under pressure from rising and volatile costs. The DecisionNext Finished Goods Index brings together key commodity prices in one clear, customizable view, showing how rising raw material costs are affecting the prices of everyday products. And then it goes a step further by delivering a six-month forecast, helping you anticipate shifts and make faster, smarter, and more strategic decisions.
To mark its return, we’re starting with everyone’s favorite price-check: the cheeseburger. Simple and relatable, this classic benchmark is surprisingly revealing as it draws from inputs across beef, dairy, grains, oils, and other categories (Fig. 1). That means it works as a practical stand-in for bigger trends in prices and cost structure across retail, foodservice, and processing sectors.
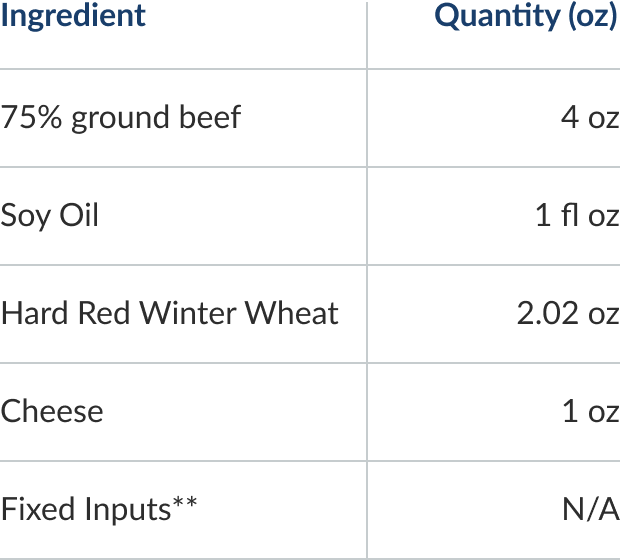
Figure 1 – The cheeseburger recipe featuring ingredients and weights for the raw materials components
Over the coming months, we’ll expand the DecisionNext Finished Goods Index Report to cover other finished goods in order to show a wider range of market trends. But today, we’re sinking our teeth into the cheeseburger.
Cheeseburger Index Hits All-time High for July
The Finished Goods Cheeseburger Index compares the aggregated raw material input costs from the most recent month (in this case July 2025) to the average of those same inputs across 2024. The result is an index where 2024 serves as the baseline, set to 100, making it easy to see how input costs are shifting relative to that year. See the Index Methodology page for a more detailed explanation.
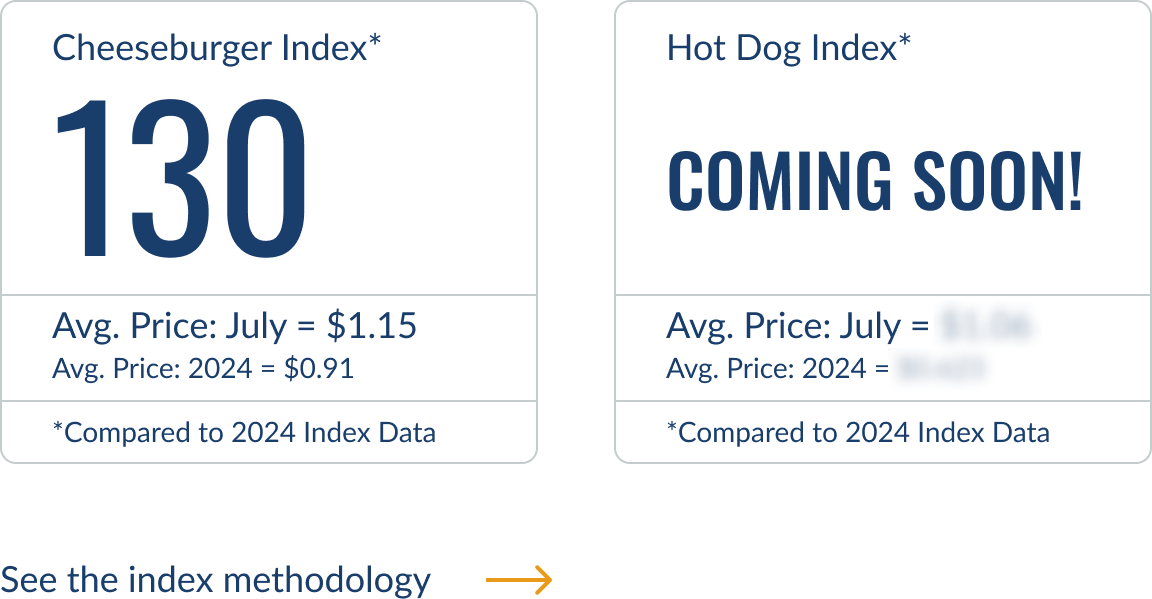
In July 2025, the DecisionNext Finished Goods Index hit 130 (Fig. 2). This shows a 30% rise in aggregate raw-material input prices compared to the 2024 average.
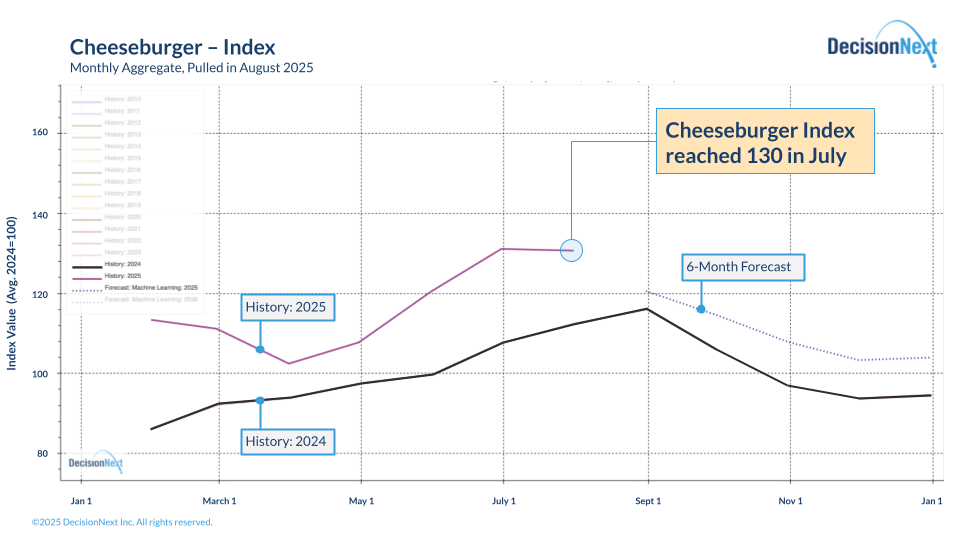
Figure 2 – The Cheeseburger Index reached 130 in July 2025.
Year-Over-Year Comparison & 6-Month Forecast
The total raw material cost for a cheeseburger reached $1.16, the highest July amount on record. For those watching year-over-year movement (YoY), July 2024 averaged $0.99, a full $0.17 below this July’s price (Fig 3).
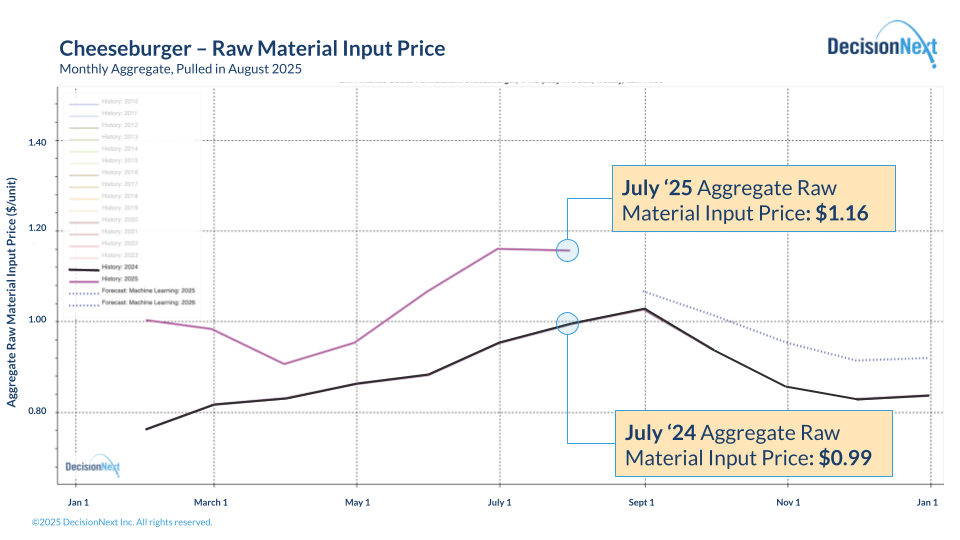
Figure 3 – The aggregate raw material input price for a cheeseburger reached $1.16 in July 2025, a $0.17 YoY increase.
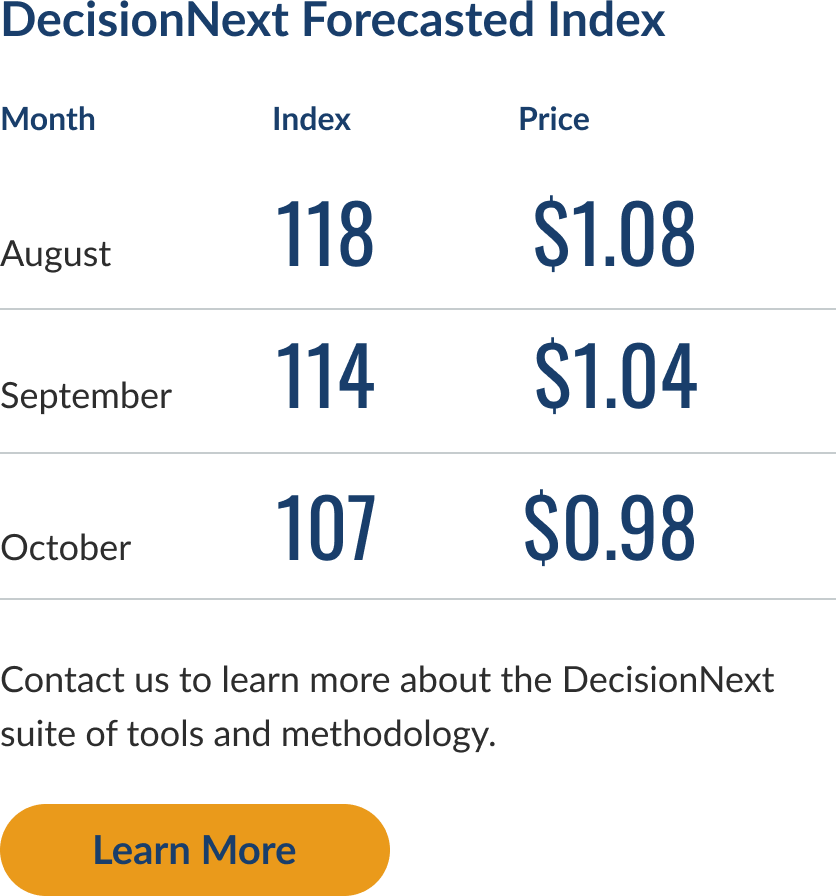
Figure 3 also includes a six-month forecast. While the projection shows that raw material input prices are expected to decline, falling steadily by about 15% from early September 2025 through early December 2025, they will remain significantly elevated compared to YoY levels (Fig. 3).
Raw Material Deep Dive
While price fluctuations in cheese, wheat, and oil have an impact on the overall price of the cheeseburger, it is the all-time-high beef trim that is the main driver behind the elevated cheeseburger price.
The DecisionNext Cheeseburger recipe uses a 75% lean ground beef blend to reflect how large restaurant chains and commercial patty producers typically build their formulations. This leanpoint is achieved by blending 50% and 90% lean trim at a 3:5 ratio. That same ratio is applied to DecisionNext’s machine learning forecasts for each trim type to generate a reliable six-month outlook for 75% lean ground beef.
The price of 50% lean trim was up over 105% in July 2025 YoY, reaching record highs of $2.50. The price of 90% lean trim also hit all time highs peaking at $4.15 in July 2025, up significantly from $3.75 last July. Both trim series are projected to experience a dramatic price drop through year-end (Fig. 4). This anticipated drop in the price of 75% ground beef plays a large part in the significant decline in the forecasted price of the Cheeseburger, which is expected to bottom out just above $0.90 in January 2025 (Fig. 3).

Figure 4 – Driven by all-time-high prices of 50% lean trim and 90% lean trim, 75% ground beef was the primary contributor to the record-high Cheeseburger Index Value in July, 2025.
What This Means for Your Business
The return of the DecisionNext Finished Goods Index offers a clear and intuitive way to track and anticipate cost shifts across the supply chain. Customers can now better assess pricing power, plan procurement, and protect margins. All thanks to the index’s link between commodity trends and finished goods.
Whether you’re a retailer, processor, or foodservice operator, the Cheeseburger Index gives you a data-rich measurement of where input costs are and a digestible indication of where they are heading.
Want to explore what’s ahead? Reach out to dive deeper into the six-month outlook or to see detailed forecasts for specific raw material inputs.
Stay tuned as we expand the index in the months ahead to include a broader menu of finished goods.
Connect with us. We’ll walk you through your cost challenges and show the Index can help you make faster, better decisions for your business.About the Report
The DecisionNext Finished Goods Index showcases the value of multi-commodity finished goods cost forecasting across protein, dairy, grain, and ingredient markets (see full methodology page). By comparing the current value to the average value from 2024, it helps stakeholders visualize real-time and future cost pressures and profit opportunities across value-added food products. The tool makes it possible for users to forecast finished good costs, adjust recipes, and analyze forward-looking scenarios.

