Upgrade Your Gut
Strengthen and optimize your position within rapidly changing commodity markets with the help of cutting-edge predictive analytics. DecisionNext’s advanced AI-powered software suite provides best-in-class econometric tools for optimal risk management and decision-making in virtually any natural resource or agricultural market, traded or non-traded.
Get the best data on the market
Enjoy faster access to dynamic data and fuse it with your own
Utilize the best out-of-the-box models
Improve forecast accuracy with our curated AI-forecast models
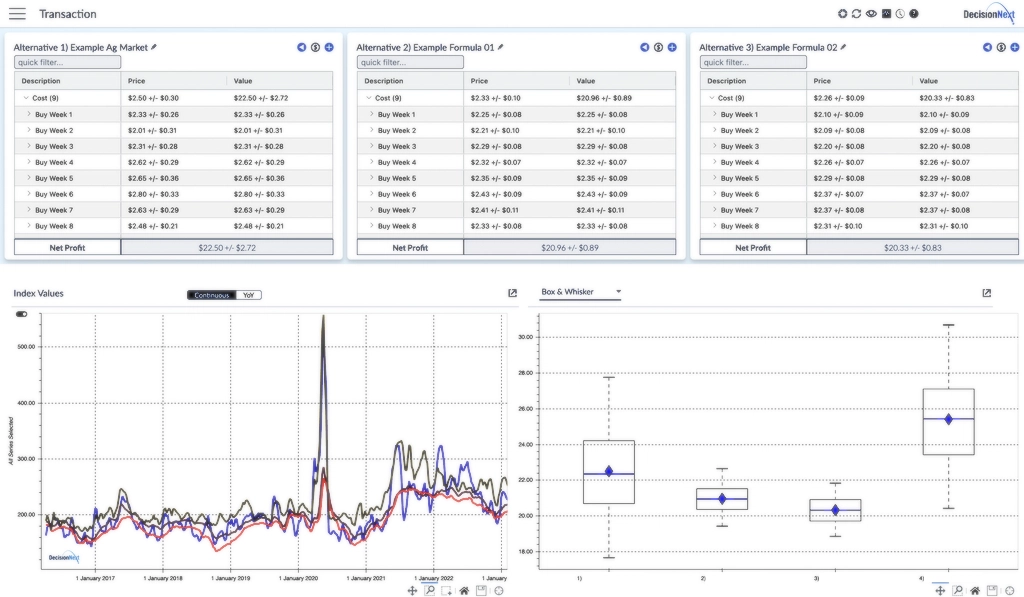
Make the best decisions every time
Quantify risk for better informed business decisions
Boost profit and manage risk
Enhance decisions with consistency and repeatability
DecisionNext is a best-in-class AI platform that empowers companies to buy or sell at the best times, with the best formulas, at the best prices.
Built in collaboration with our customers, DecisionNext has revolutionized how price and supply forecasting can improve business decisions. And it is the only platform that incorporates users’ wisdom in its algorithms!
DecisionNext is a proud AWS Partner and you can now find our solutions in AWS Partner Portal. Contact us today to learn more.
Our Commodity Expertise
Our suite of tools provides a proven formula for best in class decision making for virtually any commodity in natural resources and agriculture, traded or non-traded.
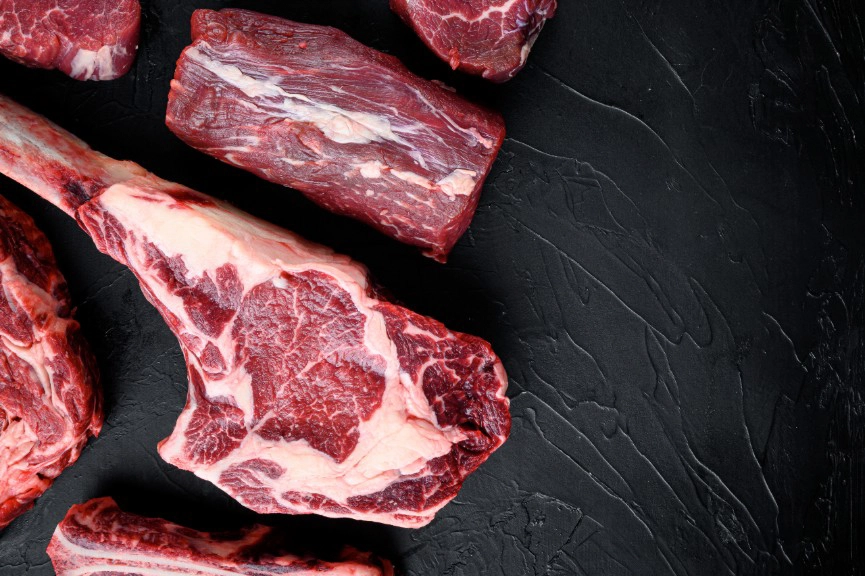
Food & Agriculture
Beef
Pork
Poultry
Dairy
Grains
Edible Oils
and more...
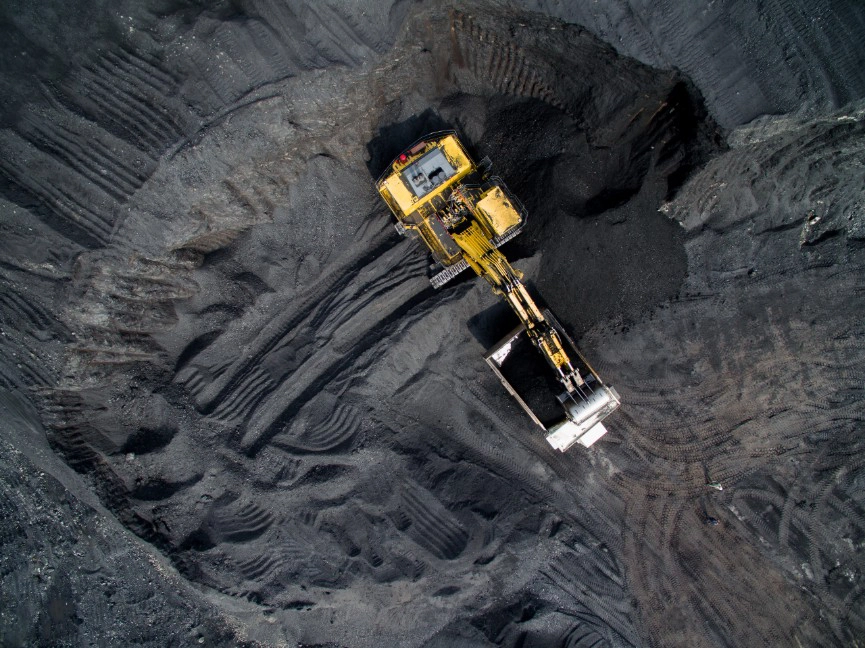
Natural Resources
Iron Ore
Thermal Coal
Liquid Natural Gas
Copper
Nickel
Zinc
Shipping
and more...
Case Studies
Increase Ad Plan Margin by 6% with DecisionNext
Introducing an innovative way for the industry to forecast beef prices.
You're in Good Company
Here are some of our amazing customers.
Don't Take Our Word For It
Here's what our customers are saying.
-

"Markets have never been more volatile. More than ever buyers need the right tools to be confident that they are making the right decisions, and that’s why we rely on DecisionNext’s forecasting and transaction modeling software."
— Bruce Daley, Sr. Director of Beef Procurement & Category Management
-
"We are thrilled to be working with a world class analytics company like DecisionNext. Applying their portfolio of models to the pork market helps us see around corners and plan better for the future."
— Nick Meriggioli, CEO, Johnsonville Sausage
-

"DecisionNext has been unlike any other software supplier we have worked with through the implementation process. Great collaboration and follow through, regularly checking in for feedback and making necessary changes where needed."
— Brent Wolke, General Manager, Teys USA
Can the other guys really leverage the power of AI to minimize risk and maximize gain? DecisionNext does.
See how our AI-driven platform checks all the boxes.
SWIPE to compare
| DecisionNext | Free Data Aggregators | Paid Data Aggregators | Data Analyzer | Consulting | |
|---|---|---|---|---|---|
| Cost | $$$ | $0 | $$ | $$ | $$$ |
| Commodity Types | |||||
| Food & Agriculture |
|
|
|
|
|
| Natural Resources |
|
|
|
|
|
| Forecast Capability | |||||
| Forecasting Centralized Database |
|
|
|
|
|
| Periodic Forecasts |
|
|
|
||
| Daily On-demand Forecast Updates |
|
||||
| Weekly Outlooks up to 18 Months Out |
|
||||
| Automatically Track Accuracy |
|
||||
| Quantified Uncertainty |
|
||||
| Decision Support Tool | |||||
| Optimal Deal Structuring |
|
||||
| Forecasted Least Cost Formulation |
|
||||
| Forecasted Raw Material Utilization |
|
||||
| Proactive Risk Forecasting |
|
||||
| "What If" Analysis Tool | |||||
| Patented Expert Opinion Methodology |
|
||||
| Causal Fundamentals Analysis |
|
||||
Food for Thought
A collection of thought leadership, case studies, interviews and more.

Featured
Whetstone Distribution Partners with DecisionNext to Enhance Protein Price Forecasting
SAN FRANCISCO, California – January 20, 2026 – DecisionNext, the leading AI platform that helps companies optimize commodity buying and selling decisions, today announced …
Read Article
The DecisionNext Finished Goods Index Report | March 2026
Key Insights January indices reset slightly below the 2025 baseline across Cheeseburgers and Hot Dogs Chicken Sandwich remains deeply discounted versus last year. …
Read Article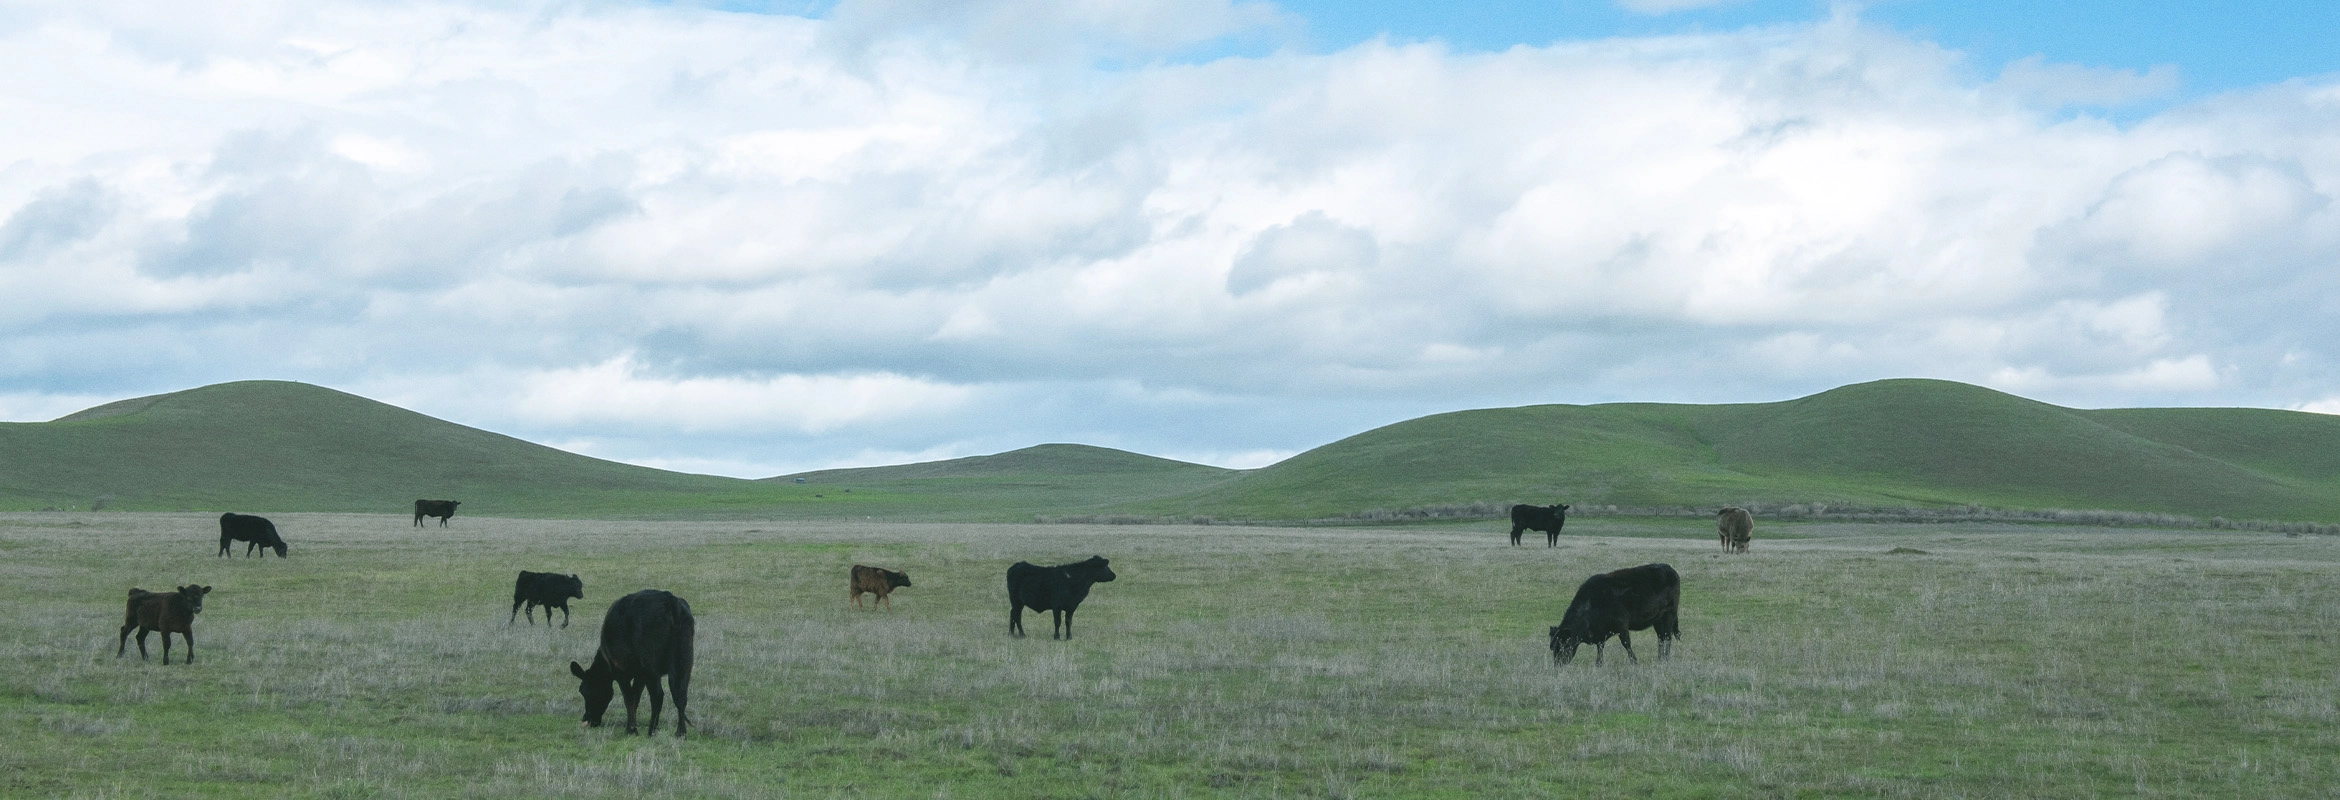
The New Reality of Beef Pricing
Navigating Structural Scarcity in the 2026 Beef Market Key Insights U.S. cattle inventory fell to 86.2 million head in January, establishing a structural supply floor. …
Read Article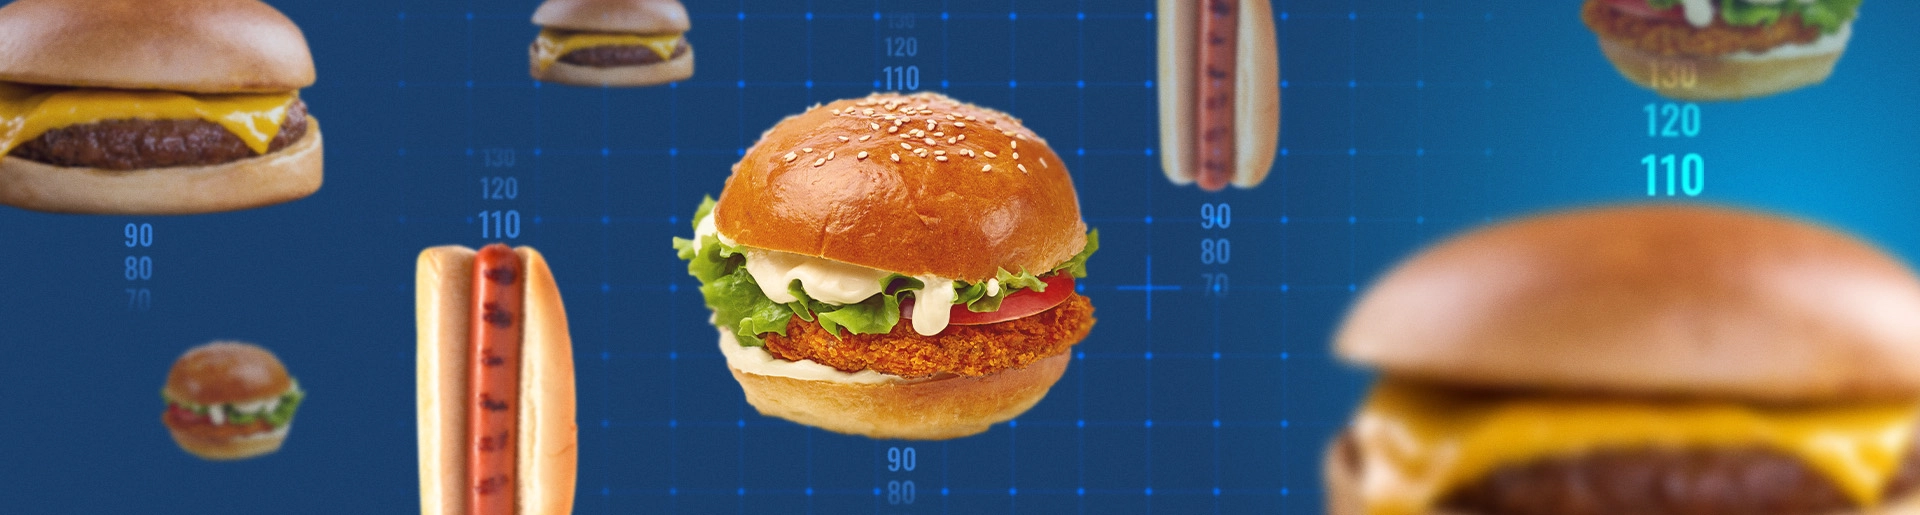
The DecisionNext Finished Goods Index Report | January 2026
Key Insights The Finished Goods Index has rolled its base year from 2024 to 2025 Cheeseburger prices are projected to rebound toward 2025 highs by summer Hot Dog index …
Read ArticleSign up for our Newsletter: The Formula
The Formula is DecisionNext’s monthly newsletter for industry insights, product updates, company news and more!
Connect the Dots
Get in touch with us to learn more about our solutions and the work we do.