Key Insights:
- Fried Chicken Sandwich Index: 77 | Price: $0.56
- Cheeseburger Index: 115 | Price: $1.03
- Hot Dog Index: 111 | Price: $0.33
- Poultry: Chicken breast fell from $2.76/lb in June to $1.14/lb in Nov — driving a 49% drop in sandwich cost.
- Forecast: Modest firming expected across proteins into early 2026, remaining below 2025 highs.
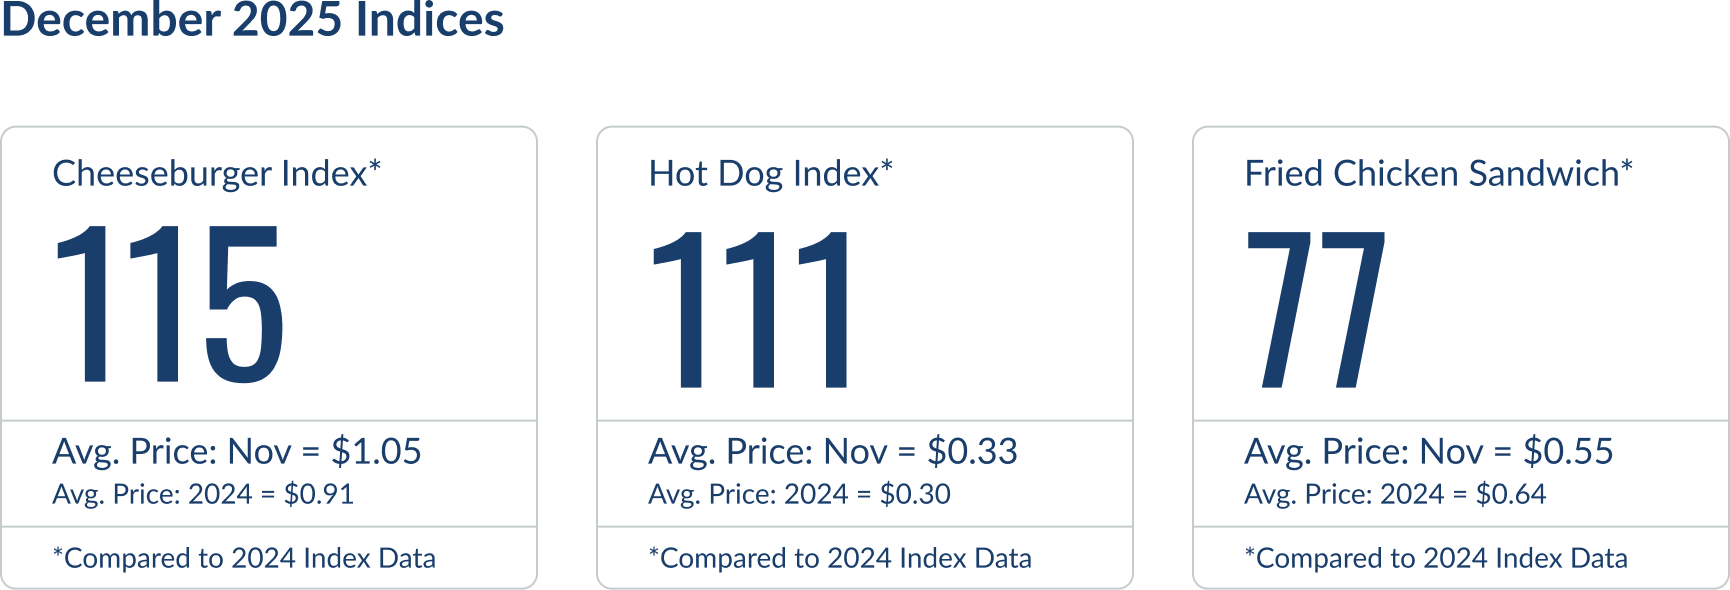
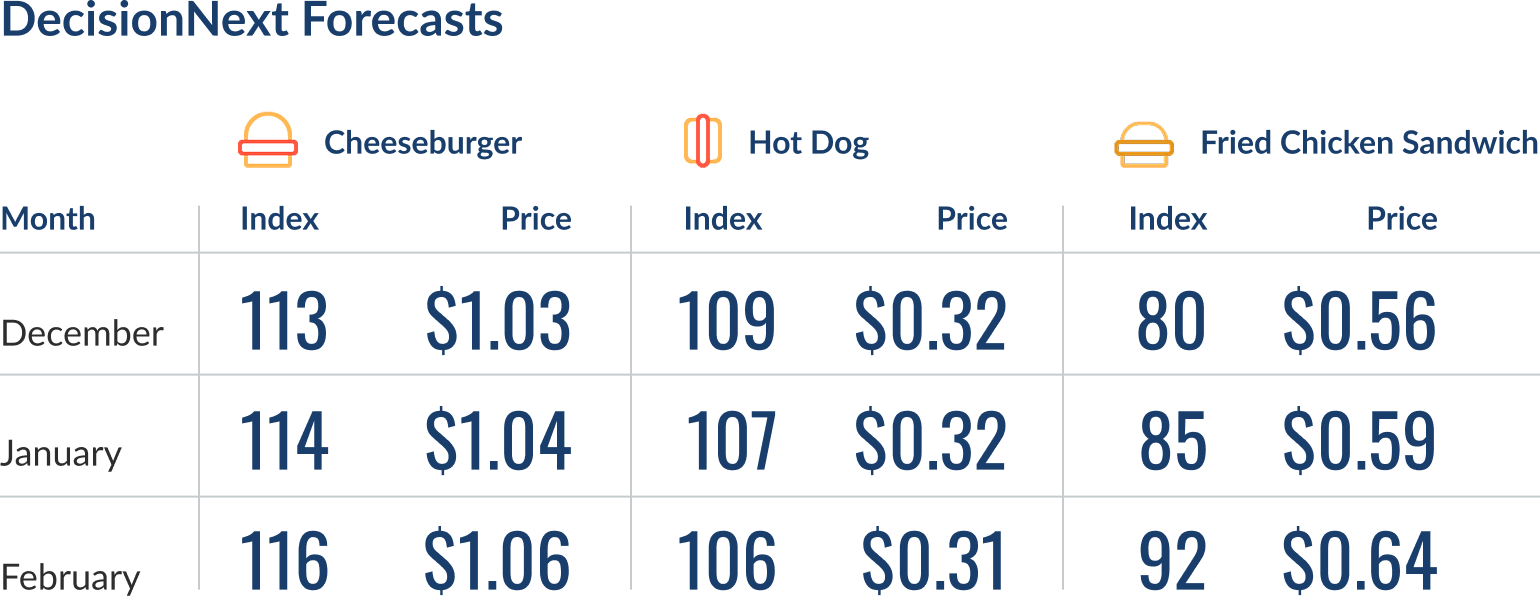
Figure 1 – With the Cheeseburger stead, the Hot Dog elevated, and the Fried Chicken Sandwich correcting sharply, DecisionNext now provides full cross-protein insight.
![]()
A New Benchmark Takes Flight
This month, the DecisionNext Finished Goods Index gets a major upgrade with the release of the Fried Chicken Sandwich Index—our newest lens into how raw material markets shape the prices of everyday finished goods. Built on the same robust methodology, with historical data back to 2010 and a six-month forward forecast, the Fried Chicken Sandwich Index brings fresh perspective to one of the fastest-growing and most competitive categories in food.
Why introduce it now?
Across the value chain, teams continue to navigate persistent volatility in poultry, grains, and vegetable oils. The Fried Chicken Sandwich brings these markets together in a single, intuitive benchmark. Featuring inputs like boneless skinless chicken breast, hard red winter wheat, and soybean oil, the index provides a comprehensive view of how cost pressures move through a modern QSR staple (Fig. 2). As with the Cheeseburger and Hot Dog Indexes, the goal is clarity: a practical proxy that reflects broader market dynamics.
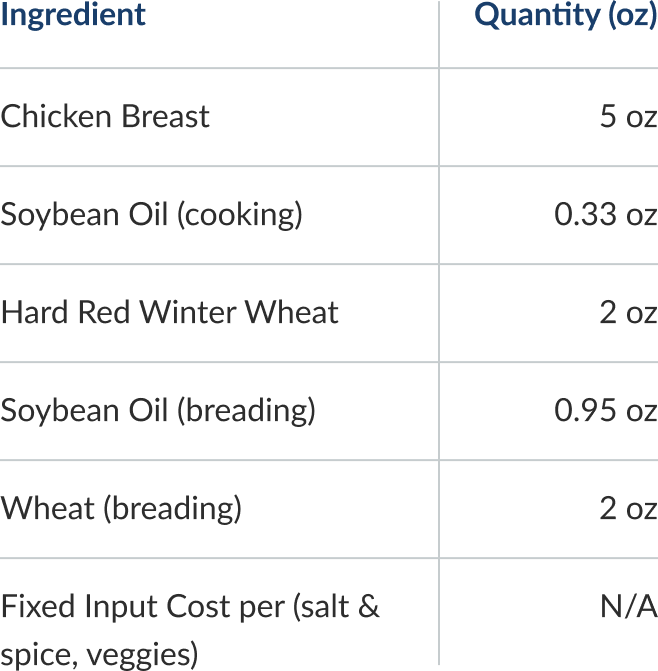
Figure 2 – Fried Chicken Sandwich recipe used for the DecisionNext Finished Goods Index.
The fried chicken sandwich also expands the DecisionNext FGI suite into new protein territory. With the Cheeseburger and the Hot Dog offering a view into the pressure dynamics of the red meat complex, the addition of poultry offers users a deeper, more diversified understanding of finished goods economics across the entire protein complex.
Over the coming months, we’ll continue to broaden the DecisionNext Finished Goods Index to capture even more categories and cross-commodity behaviors. But today, we’re biting into the Fried Chicken Sandwich.
Deep Dive: Understanding the 2025 Poultry Whiplash
The debut of the Fried Chicken Sandwich Index arrives at a moment when poultry markets have undergone one of their sharpest swings in recent years. Through spring and into early summer 2025, boneless/skinless chicken breast prices surged well above historical norms as restaurant and retail promotions collided with a relatively tight spot market. Broiler meat remained the most-consumed U.S. protein, beef prices stayed historically elevated—pushing buyers toward chicken—and breast availability was thin coming out of winter.
By May, boneless skinless breast prices reached $2.76/lb, roughly $0.75 above the five-year seasonal average (Fig. 3). At that point, chicken breast alone contributed $0.86 of the total $1.05 Fried Chicken Sandwich cost—demonstrating just how sensitive this finished good is to poultry fundamentals.
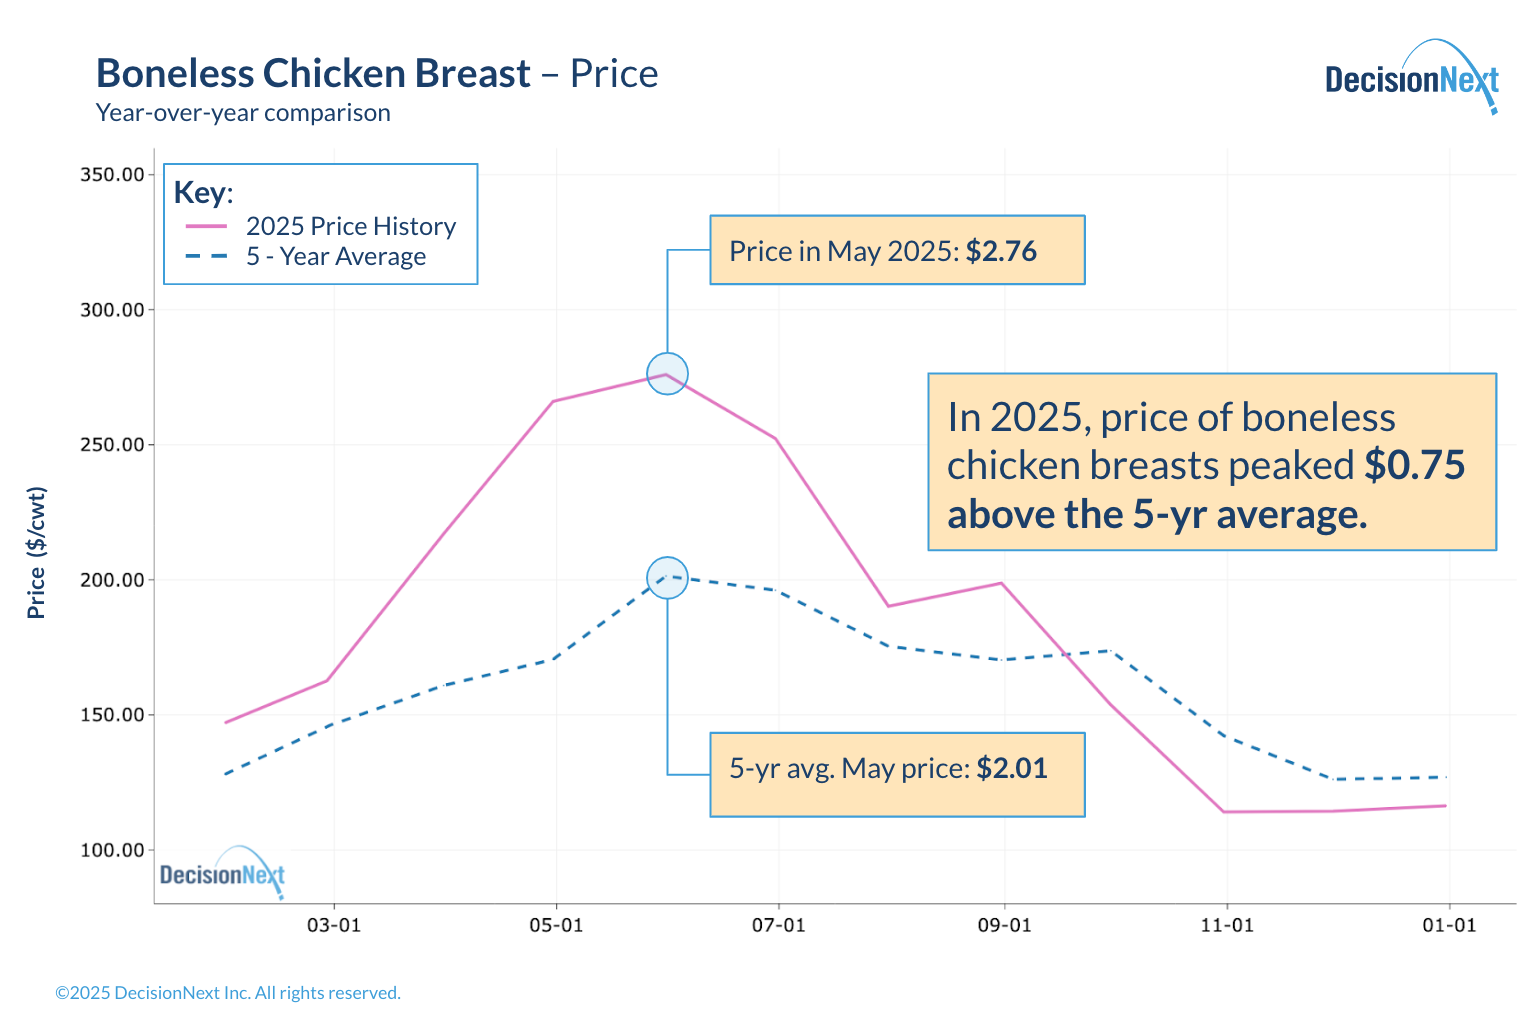
Figure 3 – Boneless chicken breast year-over-year price comparison.
But by mid-summer, the dynamics had shifted. Earlier chick placements began to flow through plants, bird weights increased, inventories rebuilt, and the promotional pulse faded. As supply caught up with demand, breast prices retreated steadily, falling to $1.14/lb by November. That brought the breast component of the sandwich down to $0.36, compressing the overall cost structure.
The impact on the finished good was striking: the cost of the DecisionNext Fried Chicken Sandwich dropped from $1.05 in June to $0.54 in November, a decline of nearly 49% in just five months (Fig. 4). While wheat and vegetable oil provided additional stability, poultry remained the dominant driver of both the run-up and the correction.
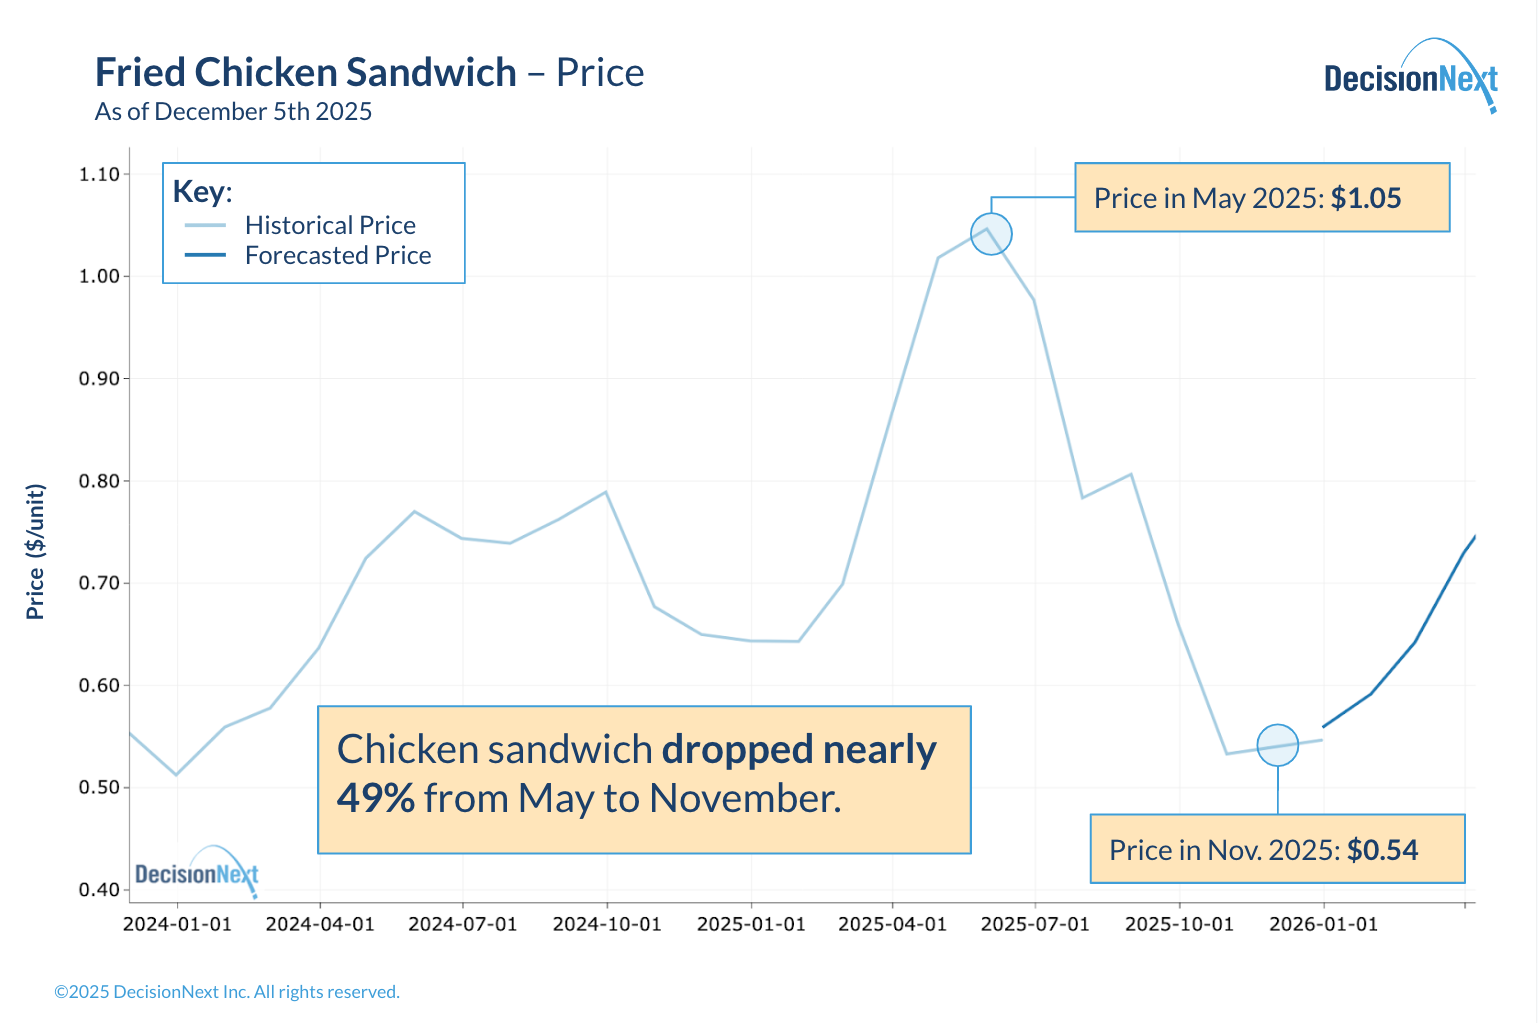
Figure 4 – Fried chicken sandwich price history and forecasted price.
Looking ahead, the model forecasts a gentle rebound in early 2026 as seasonal demand normalizes and prices stabilize. Even so, projected values remain well below the highs seen last spring, offering improved planning conditions for processors, retailers, and foodservice operators who rely on chicken as a core menu item.
The Fried Chicken Sandwich Index illustrates how quickly raw material markets can reshape finished goods costs—and why a poultry-focused benchmark is now an essential component of the DecisionNext Finished Goods Index suite.
What It All Means For You
The December 2025 FGI marks an important step forward as the Fried Chicken Sandwich Index joins the Cheeseburger and Hot Dog benchmarks, rounding out the suite with full coverage across the major U.S. protein markets: beef, pork, and poultry. With poultry now incorporated, the monthly DecisionNext Finished Goods Index Report provides a more complete picture of how protein dynamics shape finished-goods costs across foodservice, retail and beyond. This expanded view enables readers to compare volatility across meat categories, understand how shifts in one protein market influence demand for another, and manage cross-commodity exposure with greater precision.
For manufacturers, foodservice operators, and retailers, these movements reinforce the importance of ingredient-level visibility within finished-goods models. The rapid compression in breast meat prices — and its outsized impact on the Fried Chicken Sandwich Index — illustrates how a single input can meaningfully reshape total product costs in a short period of time. Understanding these linkages allows stakeholders to anticipate how volatility will cascade through menus, formulations, and category margins.
Looking ahead to early 2026, expectations point to modest firming in the price of the Fried Chicken Sandwich as seasonal demand normalizes and poultry markets rebalances. As the DecisionNext Finished Goods Index suite continues to expand across input categories, tracking these cross-commodity relationships will remain essential for navigating uncertainty and making proactive, data-driven decisions.
Want to see the data behind this forecast or run your own analysis?
Connect with DecisionNext or access the platform today.
About the Report
The DecisionNext Finished Goods Index showcases the value of multi-commodity finished goods cost forecasting across protein, dairy, grain, and ingredient markets (see full methodology page). By comparing the current value to the average value from 2024, it helps stakeholders visualize real-time and future cost pressures and profit opportunities across value-added food products. The tool makes it possible for users to forecast finished good costs, adjust recipes, and analyze forward-looking scenarios.