Seeing Around Corners

Published: September 9, 2025
Preparing for the Known Unknowns
As the release of the September World Agricultural Supply and Demand Estimates (WASDE) report approaches, people in the soy market are watching closely for any changes of yield estimates. In two of the past three years, the USDA has lowered soybean yield forecasts between the August and September reports. These revisions have triggered significant price shifts across soybeans, soybean oil, and soybean meal. And while volatility like this is common during the harvest window and the critical export months, it’s also predictable.
With DecisionNext’s Soy Market Simulator, you can test the impact of potential changes—such as a yield downgrade or a shift in export demand—before the USDA publishes the monthly report. That way, you’re prepared to act strategically before the market moves.
Historical Trends: How Often Does Yield Get Downgraded?
Since 1980, USDA yield estimates usually edge down slightly from August to September, averaging a 0.1 bushel per acre (bpa) drop. More recently, September revisions to yield forecasts have been even more pronounced:
- In 2022, the USDA revised soybean yield down 1.4 bpa in the September USDA’s WASDE report.
- In 2023, the yield forecast dropped 0.8 bpa from August to September in the USDA’s WASDE report.
- In 2024, the yield estimate held steady at 53.2 bpa between August and September in the USDA’s WASDE report.
A yield decline of less than 1.0 bpa might not sound like much, but even small changes can ripple through global prices and have a huge impact on how buyers make decisions.
Exploring the Soy Market Simulator
The Soy Market Simulator is an app within the broader DecisionNext platform. It’s built to help people think through uncertainty by allowing users to test changes to incredibly complex market dynamics through a relatively simple user interface. The app is structured around three interlinked sections:
- Soybeans
- Soybean Oil
- Soybean Meal
Each section includes supply and demand components, covering the previous, current, and next marketing years. So users can input scenarios changing variables like yield, exports, or crush levels—and the tool instantly calculates the impact on prices across the entire soy complex.
The Soy Market Simulator in Action
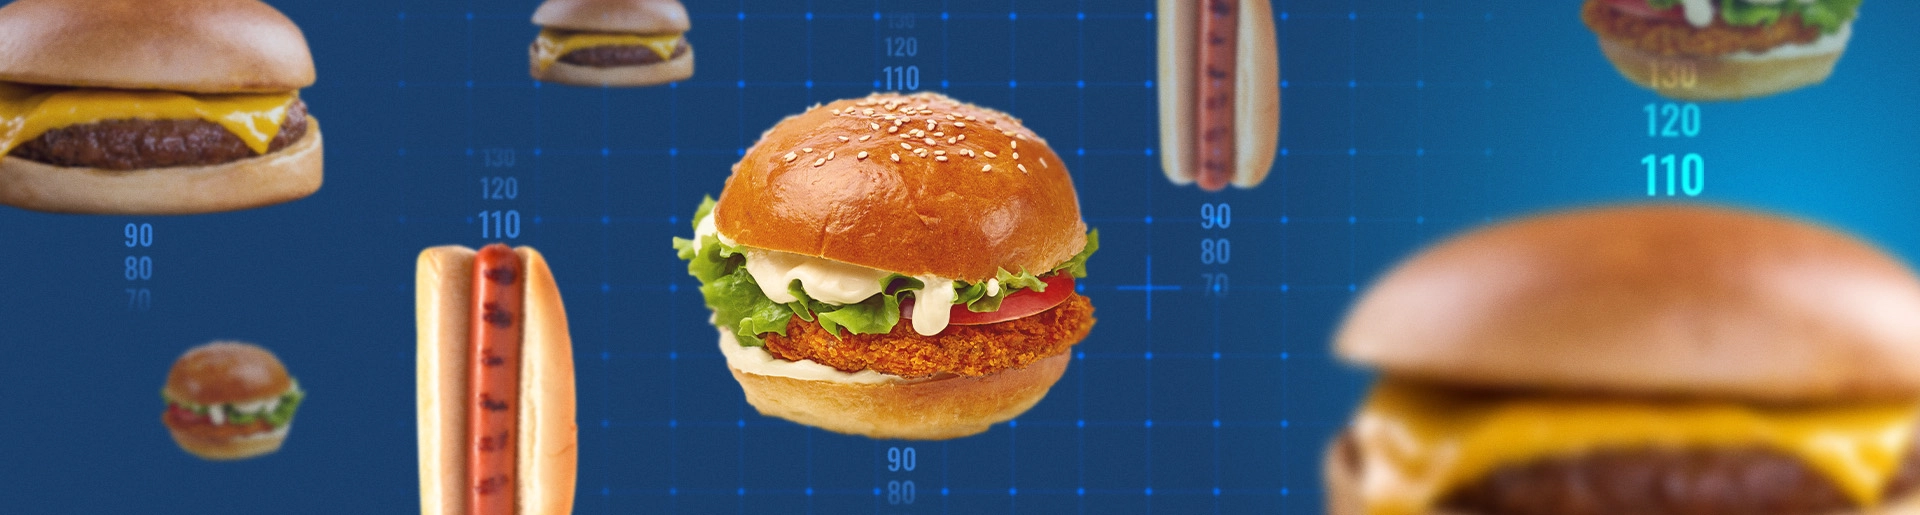
Given the trends of the last three years, one might anticipate a slight yield downgrade in the upcoming September WASDE. The DecisionNext Soy Market Simulator is built to allow you to see what could happen to the market if the USDA’s August yield numbers were downgraded from 53.6 bpa to 53.0 bpa (Fig. 1).
Figure 1 shows a screenshot from the DecisionNext Soy Market Simulator. In this example, the only assumption we are adding to the scenario is the drop in Soybean Yield. If yield drops and area harvested remains constant, then it follows that total production will drop – this calculation is performed automatically after the assumption is added to the scenario (Fig. 1).
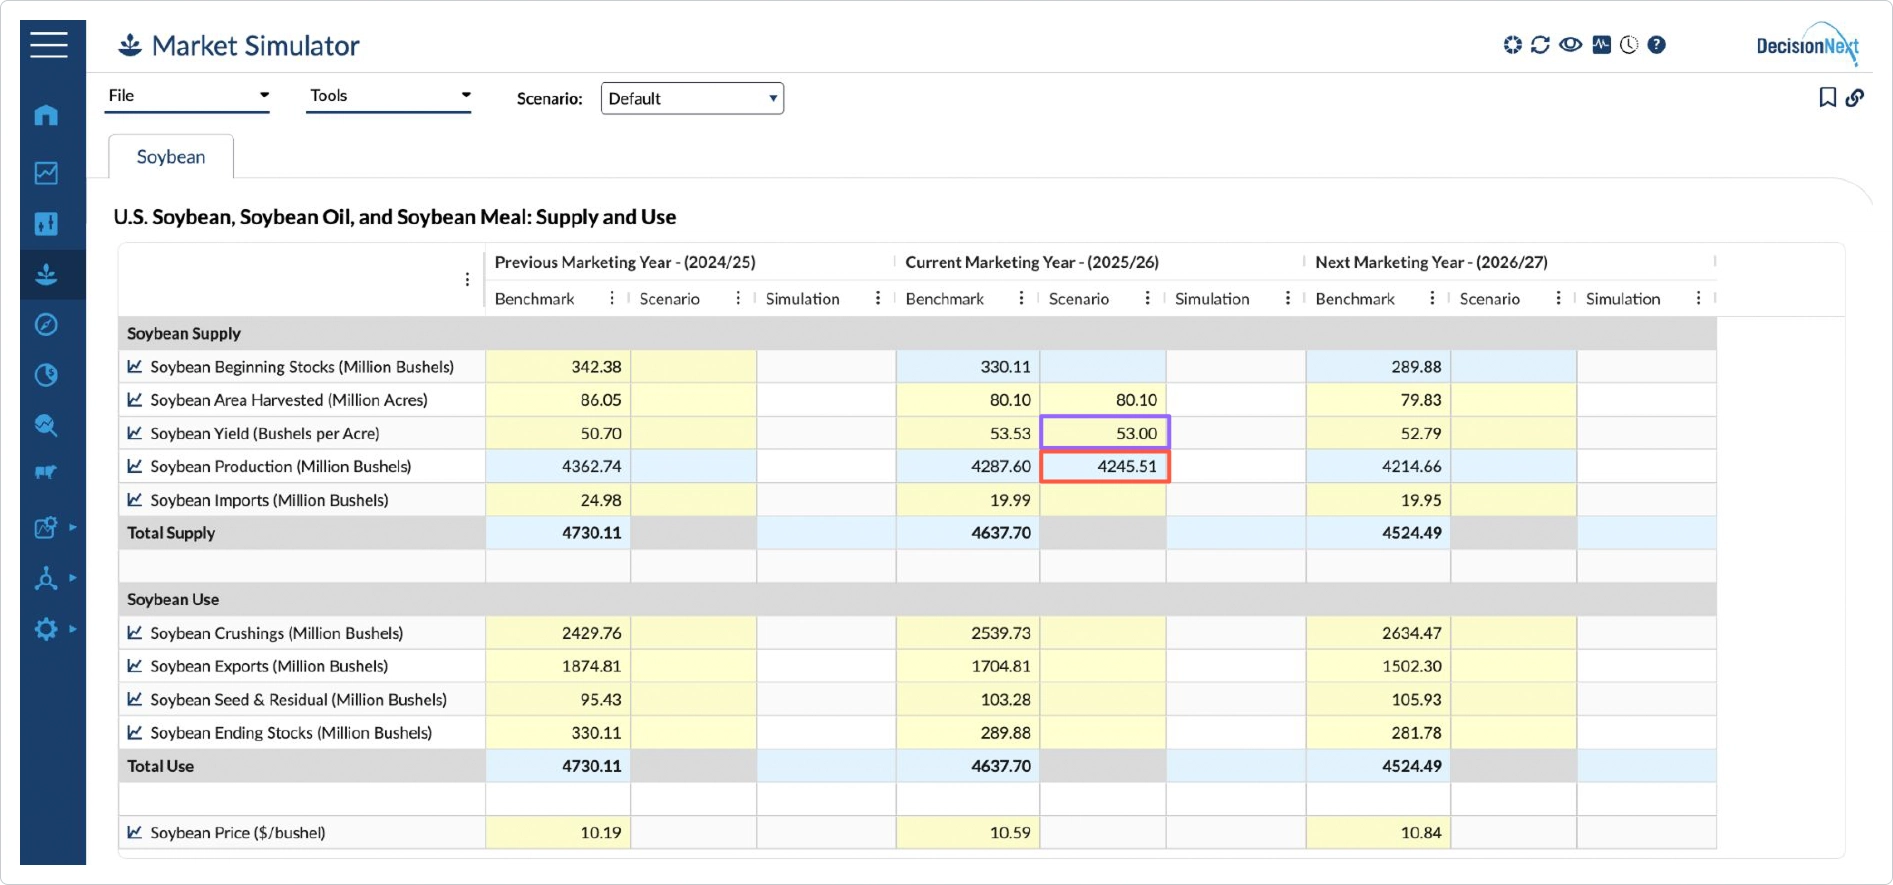 Figure 1 – Projected price impacts of a soybean yield downgrade generated by the DecisionNext Soy Market Simulator.
After inputting your assumptions into the Soy Market Simulator scenario, with the click of a button you compute the impact across the entire soy complex.
It’s that easy.
Here’s what the model forecasts in this scenario:
- Soybean price for the current marketing year increases from $10.59 to $10.82/bushel (Fig. 2)
- Next marketing year – soybean price rises from $10.84 to $10.93/bushel, as beginning stocks drop from 290M to 274M bushels
- Soybean Oil price for the current marketing year moves from 53.3 cents/lb to 54.5 cents/lb (Fig 3)
- Soybean Meal price for the current marketing year jumps from $292/short ton to $298/short ton (Fig 4)
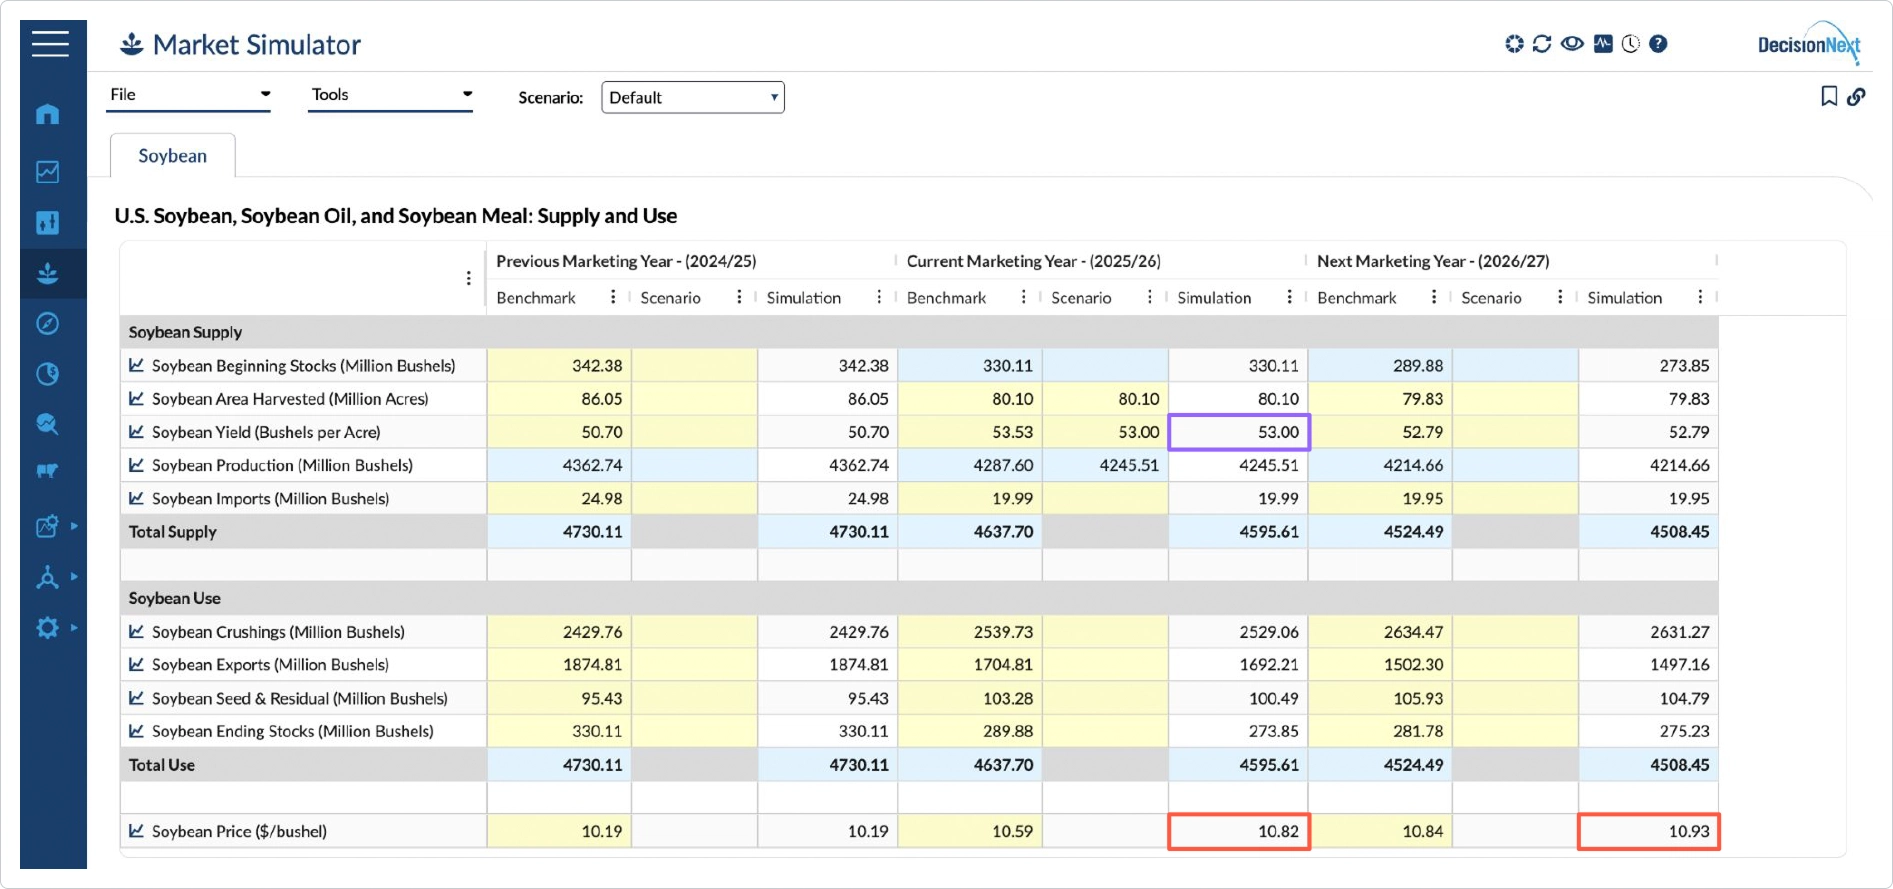 Figure 2 – Assuming that the expected yield is downgraded to 53 bpa, the DecisionNext Soy Market Simulator forecasts that Soybean Price will increase from $10.59 to $10.82/bushel this marketing year.
 Figure 3 – Assuming that the expected yield is downgraded to 53 bpa, the DecisionNext Soy Market Simulator forecasts that Soybean Oil Price will increase from 53.3 cents/lb to 54.5 cents/lb this marketing year.
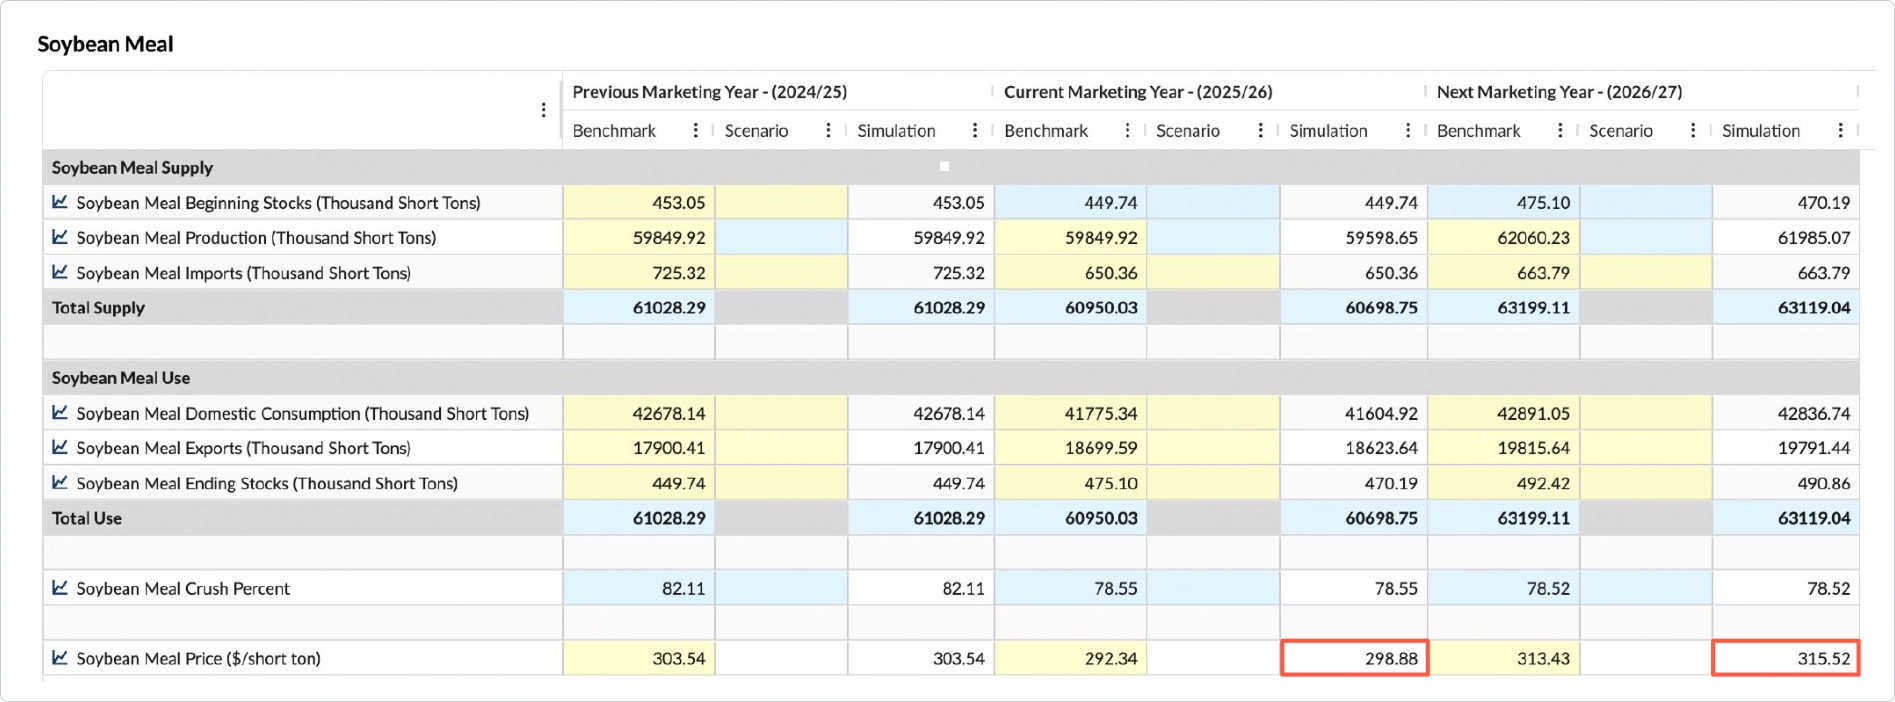 Figure 4 – Assuming that the expected yield is downgraded to 53 bpa, the DecisionNext Soy Market Simulator forecasts that Soybean Meal Price will increase from $292/short ton to $298/short ton this marketing year.
A primary feature of this application is that everything is linked together. By changing one of the Soybean supply side variables – in this case, downgrading the expected yield by 0.53 bpa – a user can see how the effects ripple throughout Soybean, Soy Oil and Soy Meal markets, in this marketing year and into the next marketing year.
These projections aren’t static—they’re dynamically generated based on real-time inputs. With this simulation, you can see how different market shifts could play out. By manipulating these scenarios, a user can quickly get a better sense of what might happen to prices (from soybeans to meal and oil) if supply or demand factors change in any of the balance sheets.
From Forecasting to Forward Planning
The September WASDE is a known unknown—everyone knows it’s coming, but no one knows exactly what it’ll bring. Once the report is published, markets often react within minutes. With the DecisionNext Simulator, you don’t have to wait to see what happens. You can test scenarios ahead of time, so when the numbers are published, you already have a plan in place.
And it doesn’t stop at soy. The same simulation logic applies across grains, oils, dairy, proteins, and other commodities that your team is tracking.
Be Prepared, Not Surprised
At the end of the day, nobody can see the WASDE numbers before they drop. But with the right tools, you don’t have to sit back and wait. Scenario simulation gives you a head start—so when the market moves, you don’t just react. You’re in a better position to plan ahead, spot opportunities sooner, and make smarter decisions—with confidence.