Finished Goods Forecast Indices: January 2024 – June 2024 vs YRAGO (Fig. 1)

Figure 1 – DecisionNext finished goods indices for January 2024 (forecast locked on 1/15/24). To see last month’s index, click here.
January 2024 Index Report
The DecisionNext platform empowers companies to buy and sell at the best times, with the best formulas, all for the best prices. These leading-edge commodity forecasting models are made possible by our team of industry experts, data scientists, and agricultural economists.
It was just last year that DecisionNext introduced the monthly finished goods index. As far as we know, this is the only index of its kind. No other publication benchmarks finished goods input prices like we do. And the “Finished Goods Index Report” section of our monthly newsletter has been extremely well received.
But we’re always looking for new and better ways to help our customers, so we took it a step further. The monthly finished goods index has been expanded to now include a six-month risk-aware price forecast.
Read the January Deep Dive below to learn more.
January Deep Dive
This month, the hamburger input prices are forecasted to be well below 2023 prices from January through at least May (fig. 2). When you consider the expected short cow and cattle supplies due to last year’s drought, this is counterintuitive.
Recent reports on U.S. cattle feed indicated a 3% increase from YRAGO as of December 1, 2023. And while that’s still above the five-year average, beef cow slaughter is down from 2022’s exceptionally high slaughter volumes. That said, we expect the winter carry-over of cows to be higher than anticipated. This will moderate hamburger input prices in the first half of 2024 with expectations of elevated slaughter levels.
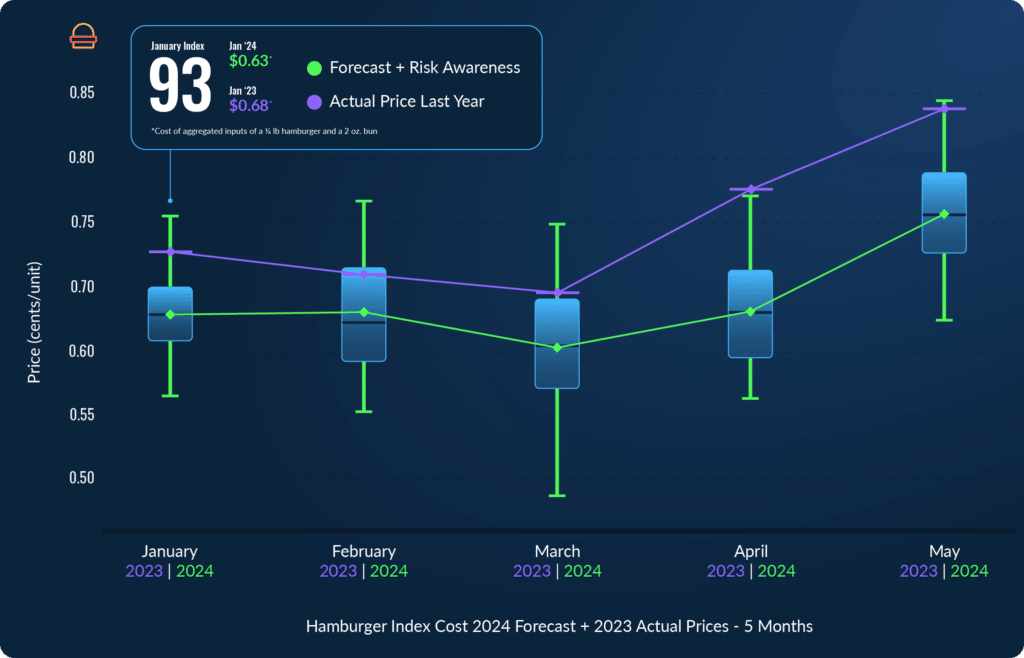
Figure 2 – Forecasted hamburger input costs Jan-May 2024 vs. actual input costs over same period in 2023.
Using AI-assisted models, the DecisionNext team has developed a risk-aware forecast. In Figure 2, the box-and-whisker charts illustrate uncertainty around a median price forecast. We can then observe where 50% of forecast simulations fell (within the box) and where 90% of the simulations fell (within the whiskers). The greater the spread from the top of the box-and-whiskers to the bottom, the higher the uncertainty.
The great thing about this quick visual is that it shows how our models identify key goods prices moving in the future. They also give valuable insight. You can see comparisons to last year and how it could impact your promotional strategies over the coming months.
Contact us if you want to see the six-month input cost forecast comparison for any of the other finished goods included in this report.
About the Report
Overall, the DecisionNext Finished Goods Index Report showcases the flexibility of our tool’s range of solutions. It offers multi-commodity forecasting for all major proteins and grains consolidated into a single finished goods forecast for illustration. The report also shows the ability to choose the timeframe for the forecast and the option to customize recipe templates to optimize finished goods profitability.
*How the Indices are Calculated:
The index for each finished good is calculated by taking the forecasted aggregate price for the inputs for the month in question and dividing it by the historical aggregate price for those same inputs over the same time period last year. Essentially, we are using the tool to forecast the finished goods cost for the month, and then making the YoY comparison to the actual cost from the previous year for that same time period.
Sign up for our FREE newsletter, The Formula.
Every month you’ll get a Finished Good Report along with a deep dive, so you can start to track important trends over time.

