Hotdog vs. Hamburger Deep Dive
Taking a closer look at what is driving the unit cost of hamburgers down while driving the unit cost of hot dogs up.
The market is currently experiencing record high beef prices causing farmers to rush animals to harvest well below seasonal weights. As a result, leaner animals are yielding an abnormally low supply of fatty beef trim (ie. beef trim with less than 60% lean content).
Hamburger production requires 81% Ground Beef, a lean point commonly achieved by mixing fatty beef trim with fresh 90% Lean Beef Trim. In turn, All Meat hot dogs use 50% Lean Beef Trim and 72% Lean Pork Trim as primary raw material inputs.
Lean inputs are relatively plentiful and cheap versus last year, which will drive the July 81% Lean Ground Beef market $.38/lb lower than last July. In contrast, fatty inputs are scarce versus last year, driving the Beef 50s market $.82/lb higher than last July.
Here’s what we see happening…
Notice the large spread between 90% Lean Beef Trim and 50% Lean Beef Trim last June, 2022 (fig. 2). Fast forward to today and we can see that the spread has tightened up considerably due to supply and demand pressures. Seeing as July finished goods are made with June inputs, this explains the forecast index relative to last year for both hot dogs and hamburgers.

The July forecast indices are based on a ¼ lb hamburger in a 2oz bun, a standard 16oz loaf of white bread, and a 1.6oz hotdog in a 2oz bun.
At the time of publishing (June ‘23) the cost of the aggregated inputs of a ¼ lb hamburger and a 2oz. bun is forecasted to be $0.62 in July 2023 vs. $0.78 in July 2022, down $0.17 YoY resulting in an index value of 78 (fig. 3).

The cost of aggregated inputs of a 1.6oz. hot dog and a 2oz bun is forecasted to be $0.22 in July 2023 vs. $0.19 in July 2022, up $0.03 YoY resulting in an index value of 110 (fig. 4).

In conclusion, due to the dynamics of the cattle herd, lean beef inputs (Beef 90s, etc.) will be cheaper while fatty beef inputs (Beef 50s, etc.) will be more expensive versus last year. These price variations will result in the cost of hamburgers dropping while the price of hot dogs continue to climb as we enter July.
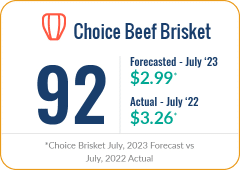
If all of this has your head spinning on what to serve at your backyard bbq this 4th of July, there is good news! Beef briskets are forecasted to be a better deal than last summer, so grab one of those and fire up the smoker!
Overall, the DecisionNext Finished Goods Index Report showcases the flexibility of our tool’s range of solutions. It offers multi-commodity forecasting consolidated into a single finished goods forecast, the ability to choose the timeframe for the forecast, and the option to customize recipe templates to optimize finished goods profitability.
*How the Indices are Calculated:
The index number for each finished good is calculated by taking the forecasted aggregate price for the inputs in July of 2023 and dividing it by the historical aggregate price for those same inputs in July of 2022. Essentially, we are using the tool to forecast the finished goods cost in a future month and then making the YoY comparison to the cost from the previous year.
What’s next?
Every month an updated set of The Finished Goods indices will be featured in The Formula. Readers can then start to track the trends over time. Additionally, each month we will do a deep dive into a selected finished good.


