Elevated inventory levels resulting from high shelf prices are putting pressure on key commodities. Expect to see the index values of our covered finished goods continue to drop over the coming months.
Are you tired of constantly monitoring the prices of various inputs and wrangling spreadsheets just to track the unit cost of your finished goods?
Look no further than the DecisionNext Finished Goods Index Report. This monthly report features index-style reporting for three common menu items: hamburger, white bread loaf, and hot dog.
The underlying value of these indices lies in the consolidation of multiple raw material forecasts which provide insights into cost projections for the finished goods. All from a single screen, users can seamlessly combine multiple raw material cost forecasts from different commodity groups. These finished goods templates can be saved and used to easily transform forecasts into the quantities required for any recipe.

Figure 1 – Finished good indices for the month of June
How the Indices are Calculated:
The index number for each finished good is calculated by taking the forecasted aggregate price for the inputs in June of 2023 and dividing it by the historical aggregate price for those same inputs in June of 2022. Essentially, we are using the tool to forecast the finished goods cost in a future month and then making the YoY comparison to the cost from the previous year.
Our forecast indices are based on a ¼ lb hamburger in a 2 oz bun, a standard 16 oz loaf of white bread, and a 1.6 oz hotdog in a 2 oz bun.
Hamburger Deep Dive:
At time of publishing (June ‘23) the cost of aggregated inputs of a ¼ lb hamburger and a 2 oz. bun is forecasted to be $0.71 in June 2023 vs. $0.82 in June 2022, down $0.11 YoY resulting in an index value of 87.
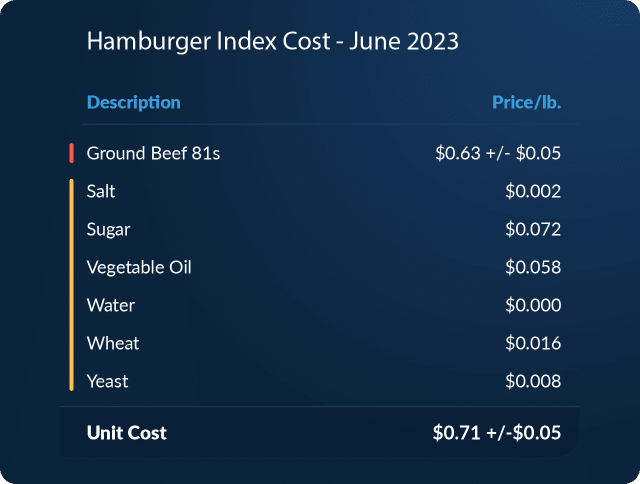
Figure 2 – Recipe for 1/4 lb hamburger and 2 oz bun loaded into DecisionNext Transaction. Note that this transaction is hypothetical.
This DecisionNext platform offers the ability to collect forecasts and fixed costs for each input for a given recipe into a fully customizable view. In our example (fig. 2) we see the recipe for a generic ¼ lb hamburger and 2 oz bun. This view combines each input variable into a finished goods forecast for the hamburger. The value for each line item (with the exception of water) is pulled in from its own forecast model.
We are forecasting the cost of hamburger inputs in June 2023 to be $0.71, down from $0.82 in June of last year. This change has primarily been driven by the decrease in the cost of ground beef.
Overall, the DecisionNext Finished Goods Index Report showcases the flexibility of our tool’s range of solutions. It offers multi-commodity forecasting consolidated into a single finished goods forecast, the ability to choose the timeframe for the forecast, and the option to customize recipe templates to optimize finished goods profitability.
What’s next?
Every month an updated set of The Finished Goods indices will be featured in The Formula. Readers can then start to track the trends over time. Additionally, each month we will do a deep dive into a selected finished good.

