The input values of a hamburger are expected to climb year over year this November while hot dog, white bread, and rotisserie chicken are forecasted to drop.
Finished Goods Forecast Indices – November 2022 – November 2023 (Fig. 1)

Figure 1 – DecisionNext finished goods indices for November 2023. To see last month’s index, click here.
The Hamburger Index Deep Dive
Due to the climbing price of lean beef, the hamburger index has jumped up to 113.
Keep in mind that the DN Hamburger Index is based off of a finished good of a ¼ lb of 81% lean beef and a 2-ounce bun. This is notable as the DN White Bread Index is down for the sixth consecutive month (see last month’s deep dive for more on white bread).
The question is “Why is the price of beef inputs for hamburger going up so much?” The answer lies in the supply side of the equation.
The majority of lean beef comes from the cow herd. Among other factors, ongoing drought conditions have forced cow herd liquidation. Starting in October of 2022, you can see the increased cow harvest, which temporarily brought a glut of lean protein to market and drove down the price of 90 lean beef.
As we’re coming off a period of record-high cow harvest levels, you can see that harvest has dropped considerably. This market shift is placing a premium on the lean inputs for hamburgers (Fig. 2).
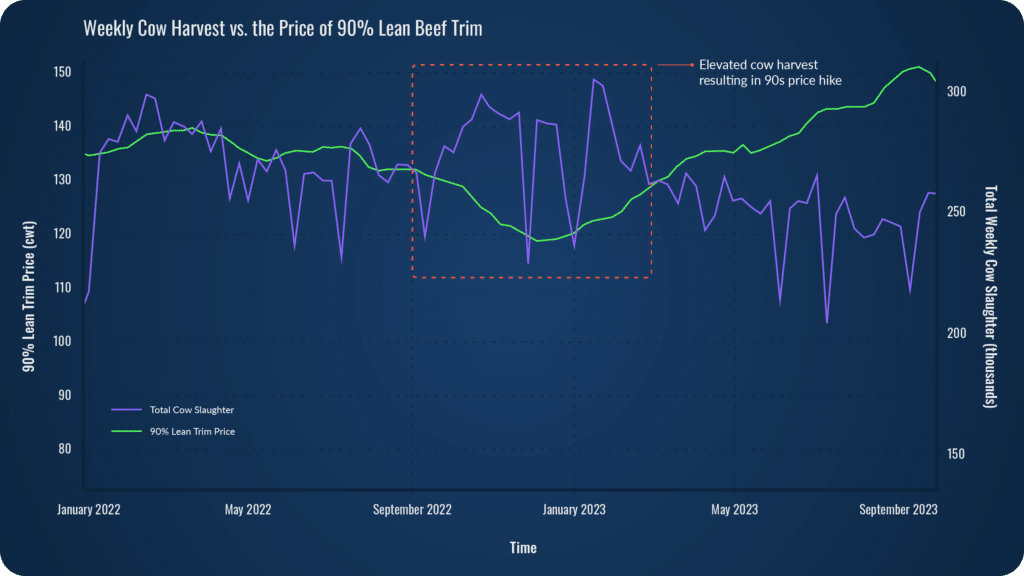
Figure 2 – Elevated cow harvest resulting in climbing 90s price
Meanwhile, 50s have come down off a high—as a primary input in all meat hot dogs, this helps explain why you can see the hot dog index has dropped below 100. It’s not just that beef is more expensive than it was a year ago. But more specifically, lean beef trim is more expensive, driving the hamburger index up to 113.
Key Takeaways
- The Hamburger Index shows a year-over-year increase, driven by one main input cost: lean beef trim.
- The price of lean beef trim is inversely correlated with the weekly cow harvest.The price of lean beef trim is inversely proportional to the weekly cow harvest.
- White bread, hot dog, and rotisserie chicken input values are forecasted to be down in November ‘23 vs. YRAGO.
About the Report
Overall, the DecisionNext Finished Goods Index Report showcases the flexibility of our tool’s range of solutions. It offers multi-commodity forecasting for all three major protein groups consolidated into a single finished goods forecast. The report also shows the ability to choose the timeframe for the forecast and the option to customize recipe templates to optimize finished goods profitability.
*How the Indices are Calculated:
The index number for each finished good is calculated by taking the forecasted aggregate price for the inputs in for the upcoming month and dividing it by the historical aggregate price for those same inputs over the same time period last year. Essentially, we are using the tool to forecast the finished goods cost in a future month and then making the YoY comparison to the actual cost from the previous year.
Sign up for our FREE newsletter, The Formula.
Every month you’ll get a Finished Good Report along with a deep dive, so you can start to track important trends over time.

