The DecisionNext Finished Goods Index Report | November 2025

Published: November 10, 2025
Key Insights
- Cheeseburger Index: 115 | Price: $1.05
- Hot Dog Index: 107 | Price: $0.32
- 50% Lean Beef Trimmings: Still nearly double year-ago levels ($1.41/lb vs. $0.67 in 2024)
- Cheese Prices: Below 2024 and five-year averages, offsetting some protein cost pressure
Forecast: Input costs are expected to soften into January before seasonal firming returns in Q2 2026.
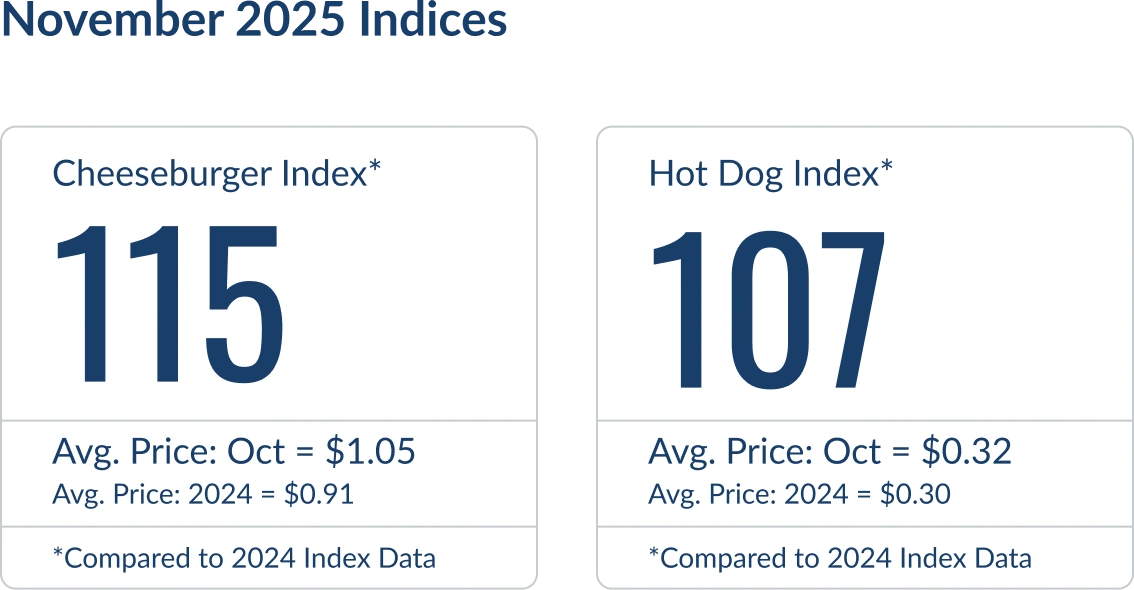
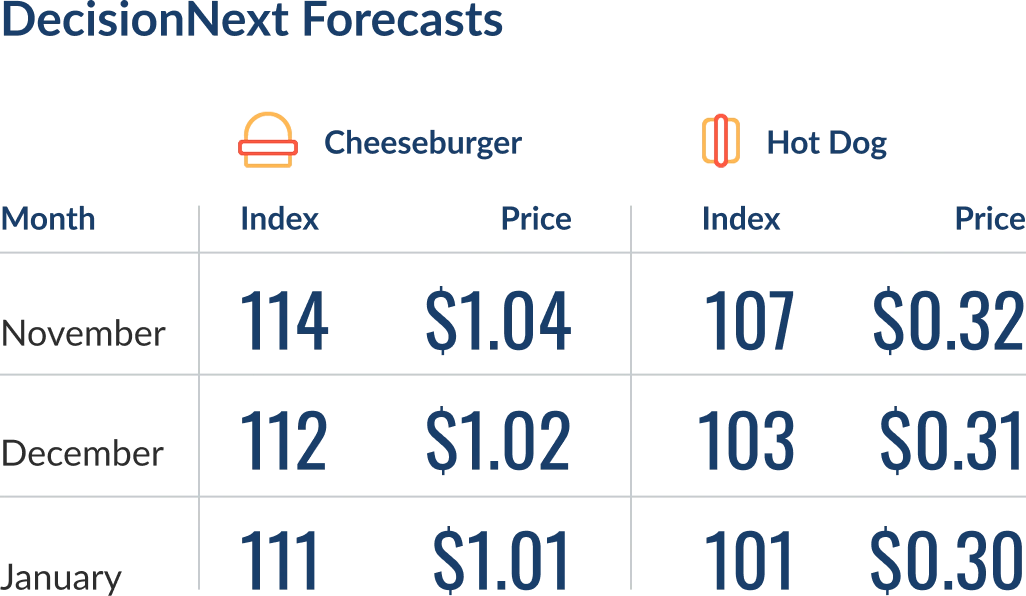 Figure 1 - Both the Cheeseburger and Hot Dog Index stabilized as Q4 demand normalized.

Cooling Into Winter: Finished Goods Ease After a Volatile Summer
Input costs remain historically elevated year over year. Even so, the November DecisionNext Finished Goods Index shows both Cheeseburger and Hot Dog indexes settling after months of mid-year volatility.
For processors, retailers, and other organizations across the food value chain, this softening reflects normalization after the record highs reached in July when lean trimmings and oilseed inputs surged on tight supply and seasonal demand.
A Closer Look at the Cheeseburger and Hot Dog
At 115, the Cheeseburger Index declined about 3.4% from last month’s 119, with the composite raw material cost easing to $1.05 per unit from $1.09.
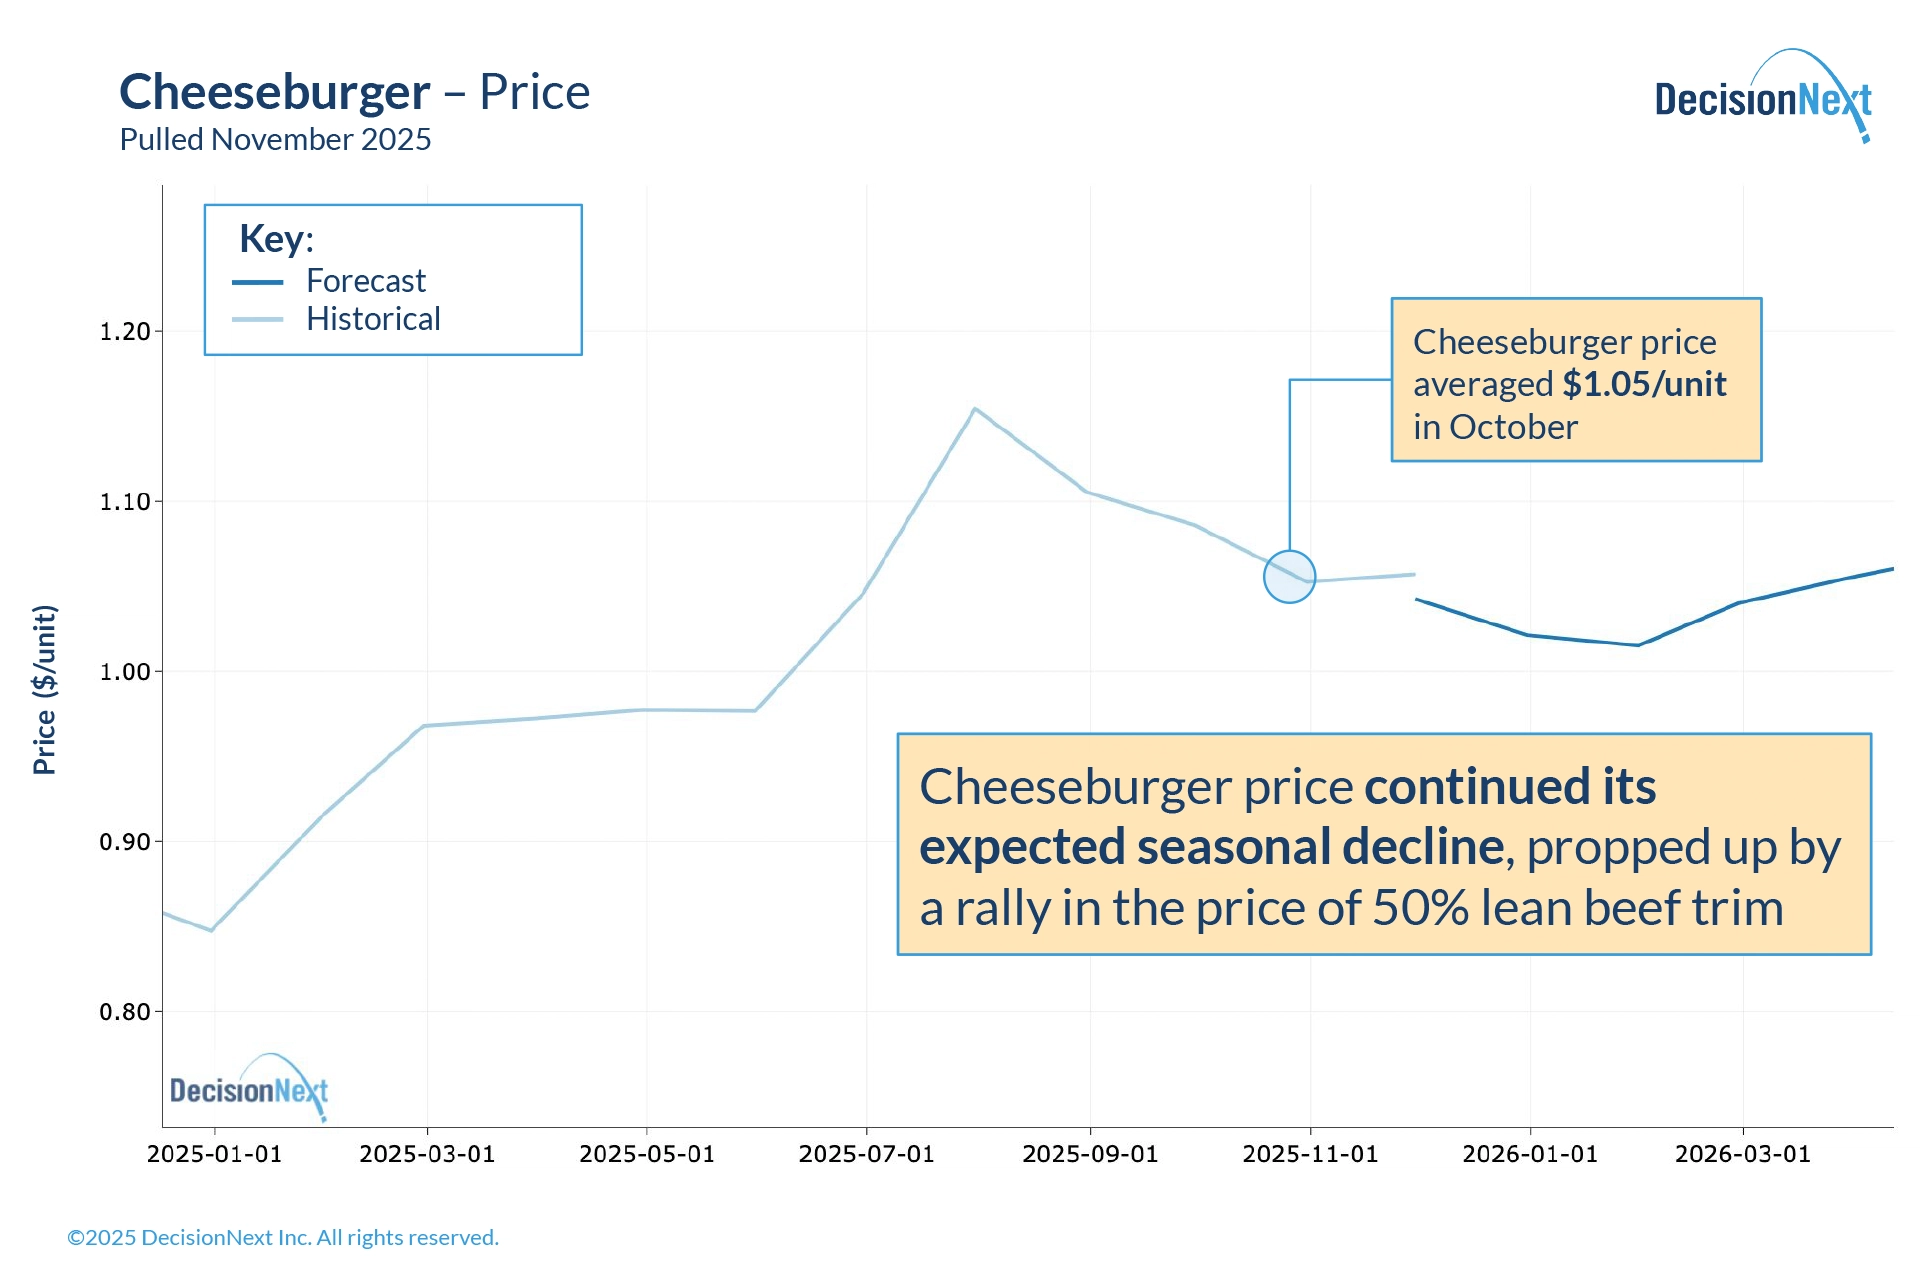 Figure 2 - While elevated year over year, cheeseburger input pricing is following a traditional seasonal pattern: softer into December before rallying into the new year.
With an index value of 107, the Hot Dog Index remains elevated relative to its baseline despite easing from midsummer highs. Composite raw material cost sits at $0.32 per unit, down from $0.34 in September.
There was a sharp increase in the back half of October. That spike was driven almost entirely by a surge in 50% lean beef trimmings. This atypical seasonal move likely reflects a recent rise in formula and forward orders, which reduced expected spot volume and pushed spot prices higher.
In October, 50% lean beef trimmings represented about 30% of hot dog input cost.
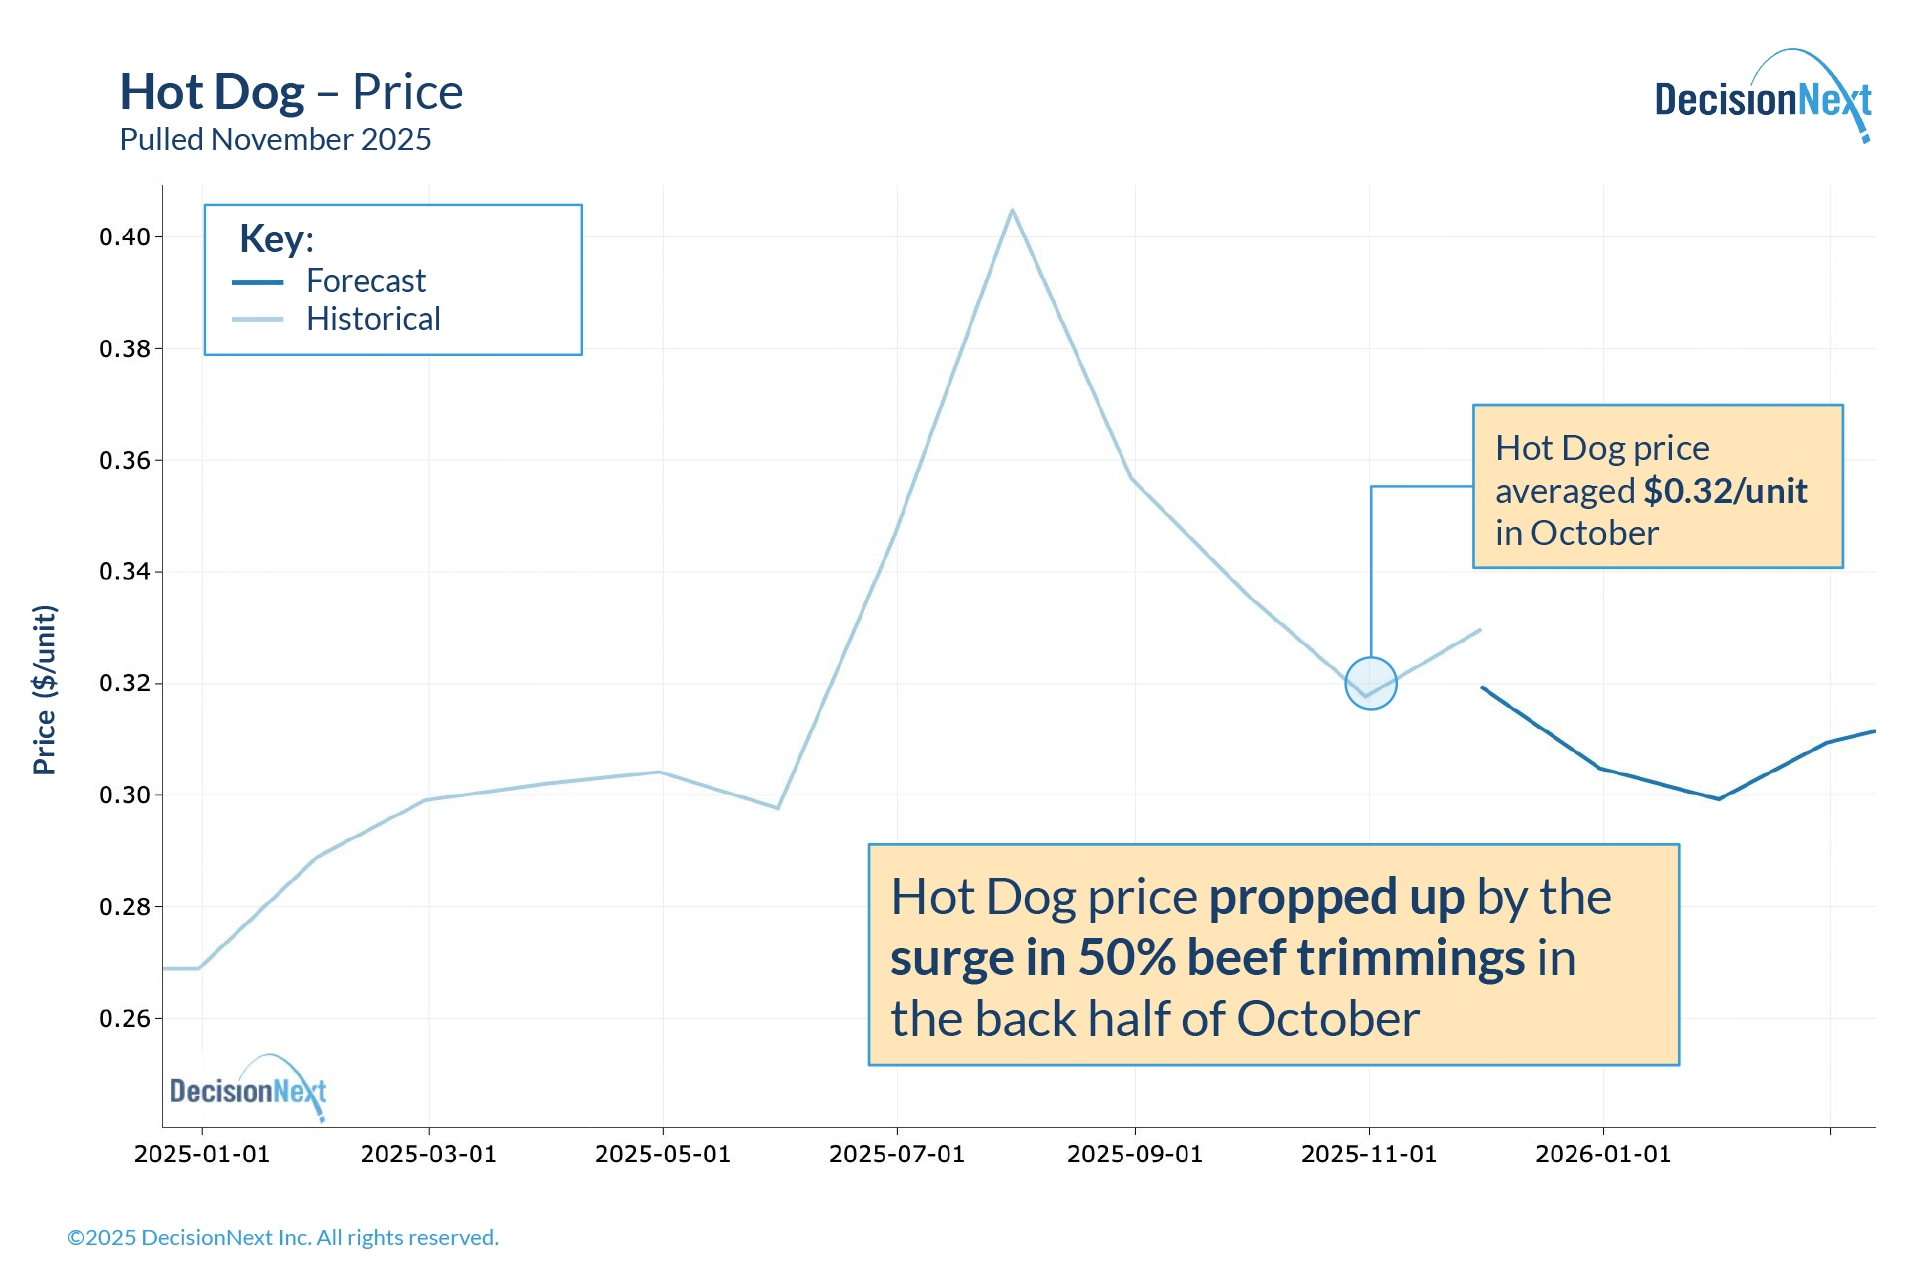
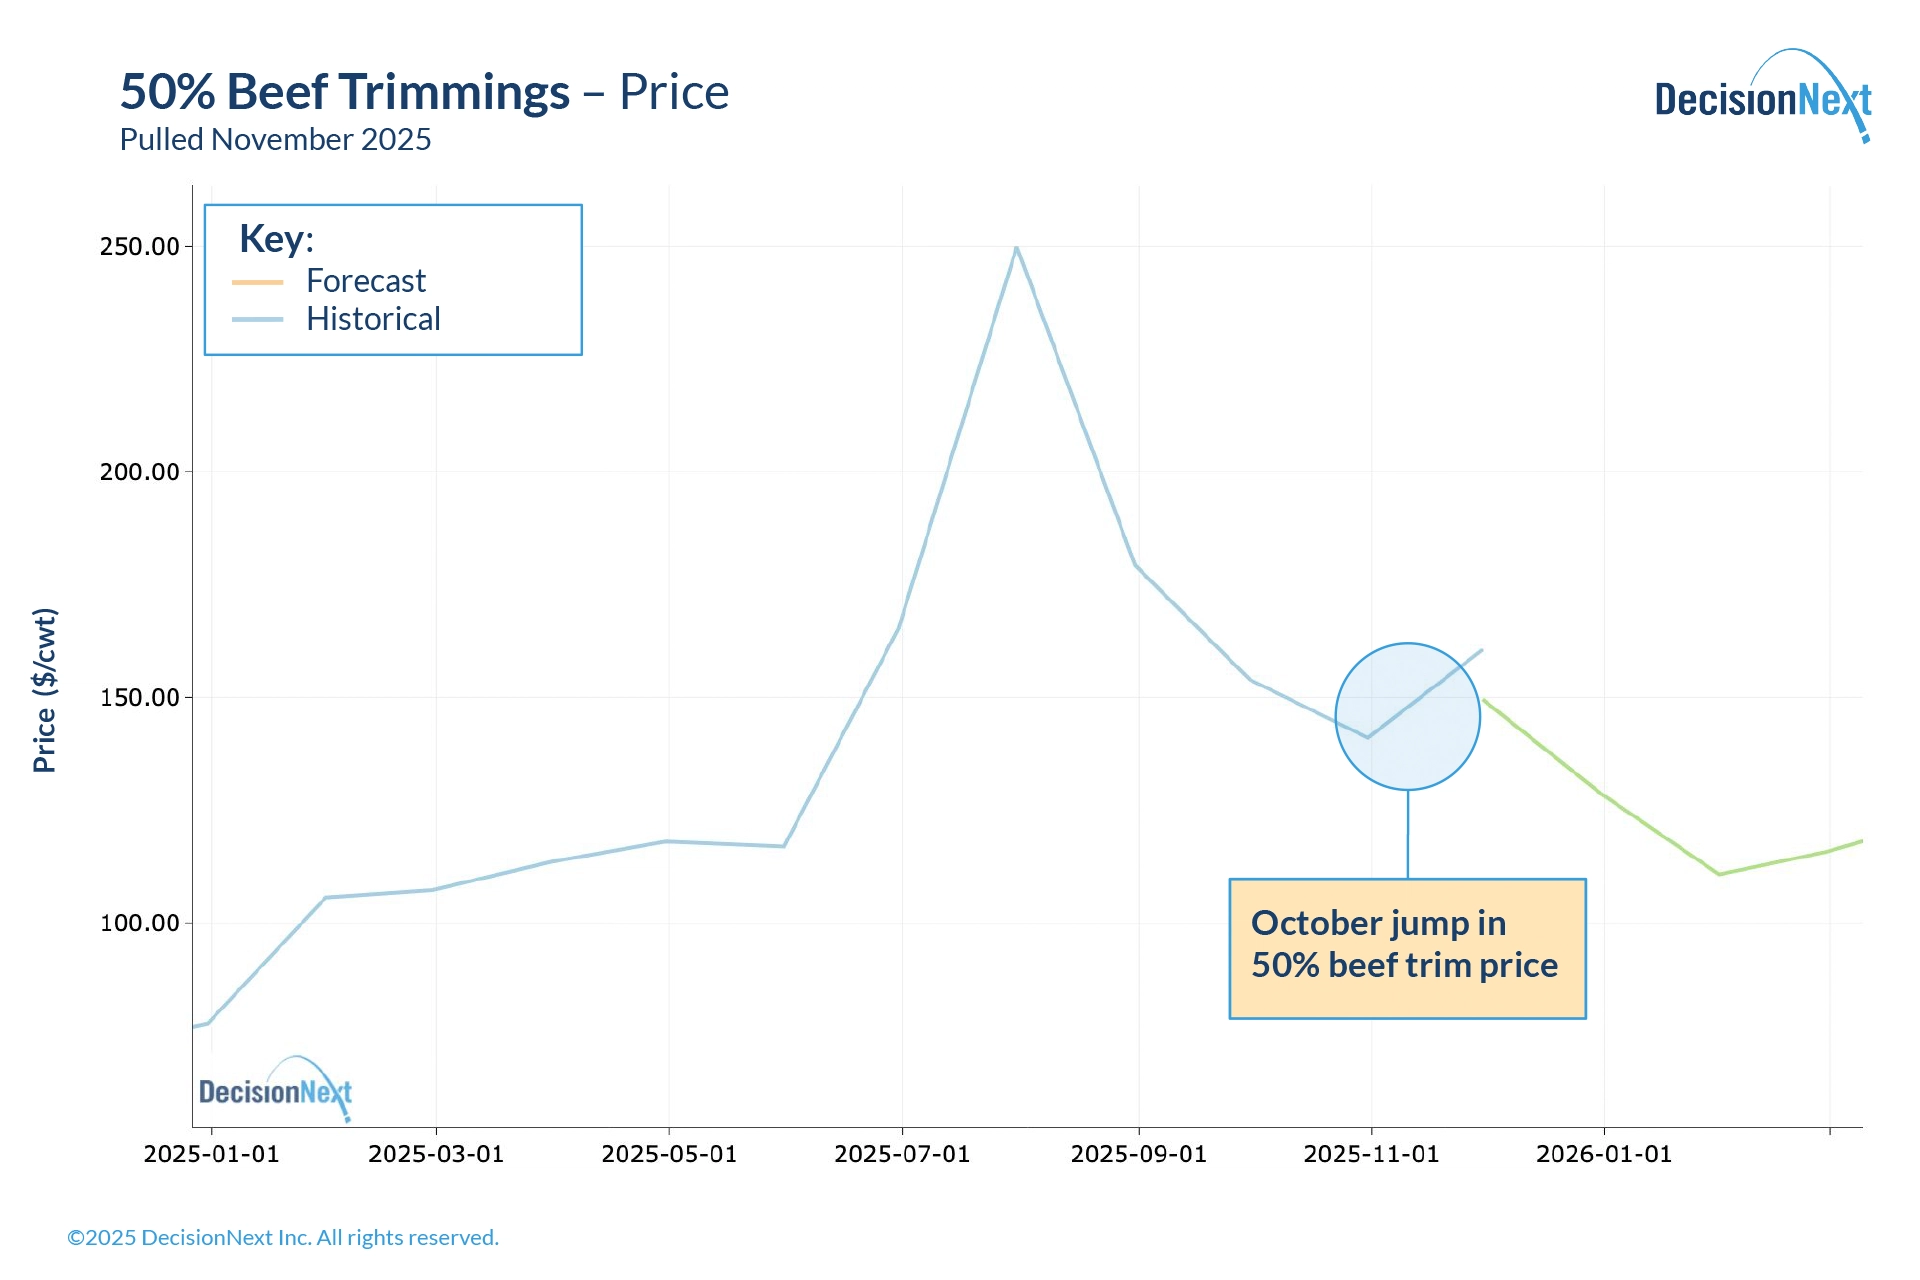 Figure 3 - Hot dog pricing is largely driven by 50% lean trimmings.
As trimming prices retreat into early 2026, DecisionNext forecasts a steady decline through January, followed by seasonal strengthening through mid-year, consistent with historical behavior.
What It Means
The November 2025 FGI shows that while overall finished-good costs have cooled, the protein complex remains structurally tight. Even modest reductions are happening from a historically high base.
For manufacturers, foodservice operators, and retailers, these moves reinforce the need for forward-looking visibility into input volatility and tracking each ingredient’s contribution inside finished goods models.
The recent surge in 50s illustrates how one input can disproportionately influence total product costs, pulling both the Cheeseburger and especially the Hot Dog Index higher.
Q1 2026 expectations suggest modest easing before markets firm again into grilling season, reinforcing the need to monitor cross-commodity linkages across the DecisionNext FGI suite.
Want to see the data behind this forecast or run your own analysis? Connect with DecisionNext or access the platform today.
About the Report
The DecisionNext Finished Goods Index showcases multi-commodity finished goods cost forecasting across protein, dairy, grain, and ingredient markets (full methodology page).
By comparing current values to 2024 averages, it helps stakeholders visualize current and forward cost pressure across value-added food products. The tool enables users to forecast finished good costs, adjust recipes, and analyze forward-looking scenarios.