The DecisionNext Finished Goods Index Report | October 2025

Published: October 8, 2025
Figure 1 – Both the Cheeseburger and the Hot Dog Index continue falling from their July highs, expected to level out going into the new year.

Key Insights:
- Hot Dog Index debuts — expanding the DecisionNext Finished Goods Index alongside the Cheeseburger benchmark.
- Raw material input price surged 33% from May to July before falling 15% into September.
- Index value peaked at 136 in July, marking an all-time high before a sustained correction.
- Forecasts project continued easing through December as protein, grain, and oil markets stabilize.
Expanding the Menu: A Broader Look at Finished Goods
This month, we’re expanding the DecisionNext Finished Goods Index with a new benchmark: the Hot Dog Index. Paired with our existing Cheeseburger Index, this new benchmark gives supply chain, procurement, and finance teams a wider-angle view of how raw material price shifts impact real-world products.
The hot dog packs a broad commodity footprint — combining beef and pork trimmings, soy, wheat, oil, dairy, and sugar (see methodology page). That makes it a strong, real-world proxy for finished good cost structures that span multiple commodity food sectors.
 Figure 2 – The hot dog recipe featuring ingredients and weights for the raw materials components.
Combined with our updated six-month forecast and back-tested data going to 2010, the Hot Dog Index offers a new lens for tracking volatility, understanding margin pressure, and sharpening planning across procurement and pricing teams.
With two iconic food staples now modeled in the DecisionNext FGI Report, we’re building a fuller picture of how raw material costs ripple through finished goods. Over time, we’ll continue adding more benchmarks — but for now this is yet another step in our mission to make commodity intelligence more strategic, actionable, and aligned with real business outcomes.
Volatility on the Grill: Summer Surge and a Sharp Cooldown
The inaugural Hot Dog Index tells a story of striking mid-year volatility. After starting 2025 at roughly $0.27 per unit, hot dog raw material costs climbed steadily through the first half of the year, reaching $0.30 in May before surging to $0.40 by July — a 33% increase in just two months (Fig. 3).
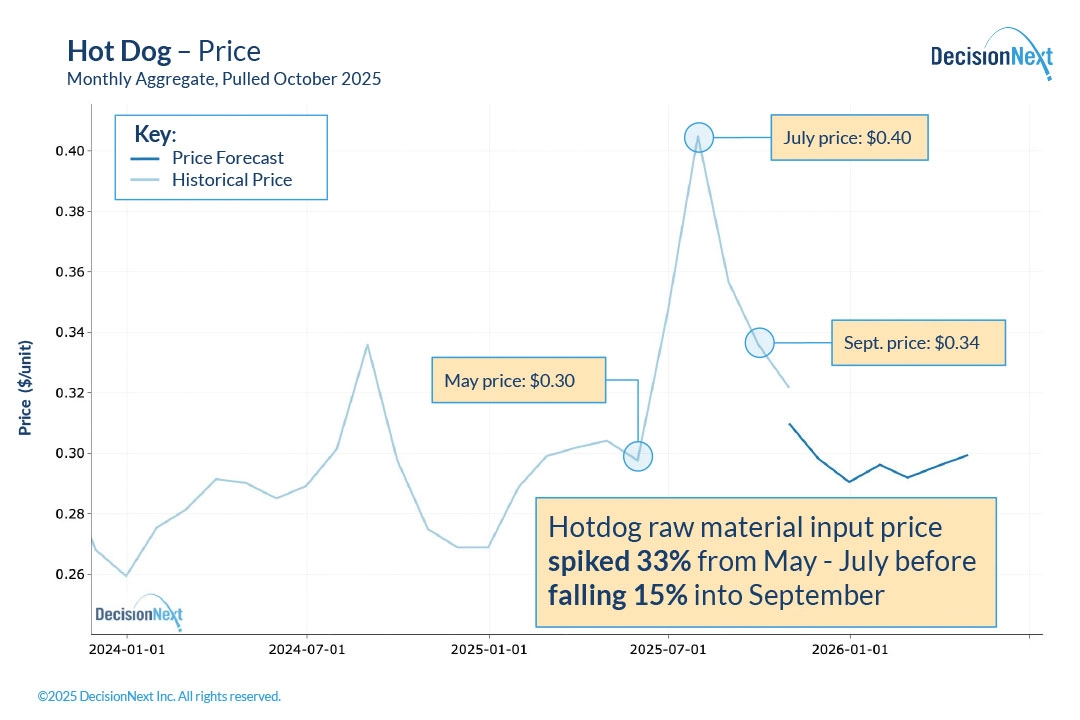 Figure 3 – The aggregate material input cost of a hot dog hit $0.40 in July and is now sitting at $0.34, expected to continue dropping into the new year.
This run-up was driven by broad-based cost pressures across multiple inputs, including beef and pork trimmings and soy meal, each of which saw tightening supplies and stronger seasonal demand. But just as quickly as prices spiked, they began to correct. By September, the composite hot dog input cost had fallen to $0.34 per unit, a 15% decline from the July peak.
Tracking the Index: From Record Highs to a Gradual Cooldown
The Hot Dog Index value followed a similar pattern. After a steady rise through the first half of 2025, the index hit an all-time high of 136 in July before entering a period of correction (Fig. 4).
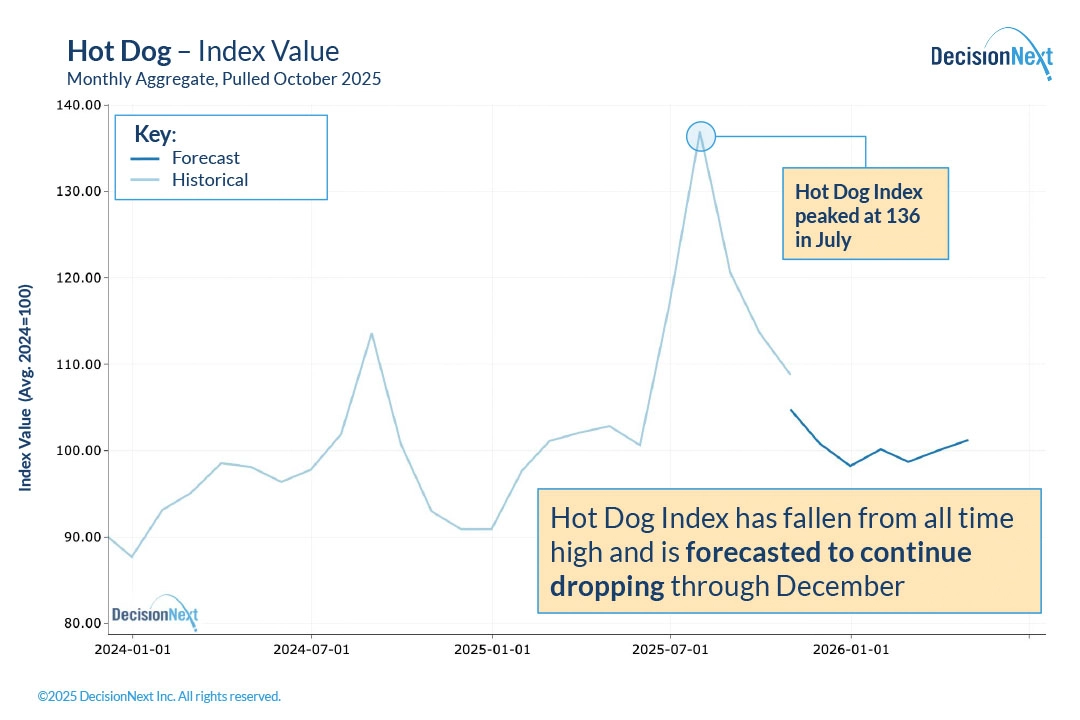 Figure 4 – The hot dog index hit an all time high of 136 in July.
Model forecasts indicate the Index is expected to continue easing through December, reflecting lower protein and grain costs alongside moderated oil and dairy markets. Current projections show stabilization early in 2026 as supply and demand rebalance across key input categories.
What It Means
For manufacturers and foodservice operators, the Hot Dog Index underscores just how quickly finished goods costs can move when multiple commodity groups tighten simultaneously. The index provides a clear, data-driven view of how raw material costs cascade into finished goods — and how quickly that momentum can reverse.
With both the Cheeseburger and Hot Dog Indexes now live and updated monthly, DecisionNext users can compare cross-category dynamics in real time, helping procurement, pricing, and planning teams anticipate where volatility may strike next.
Want to see the data behind this forecast or run your own analysis? Connect with DecisionNext or access the platform today.
About the Report
The DecisionNext Finished Goods Index showcases the value of multi-commodity finished goods cost forecasting across protein, dairy, grain, and ingredient markets (see full methodology page). By comparing the current value to the average value from 2024, it helps stakeholders visualize real-time and future cost pressures and profit opportunities across value-added food products. The tool makes it possible for users to forecast finished good costs, adjust recipes, and analyze forward-looking scenarios.