The DecisionNext Finished Goods Index Report – August 2023

Published: July 27, 2023
White Bread Loaf and Hamburger prices are down from last year. Hotdog prices are up. But will world events cause those prices to fluctuate again? Keep tracking fundamental variables to help make sure you don’t get caught off guard.
Finished Goods Forecast Indices - August 2022 - August 2023
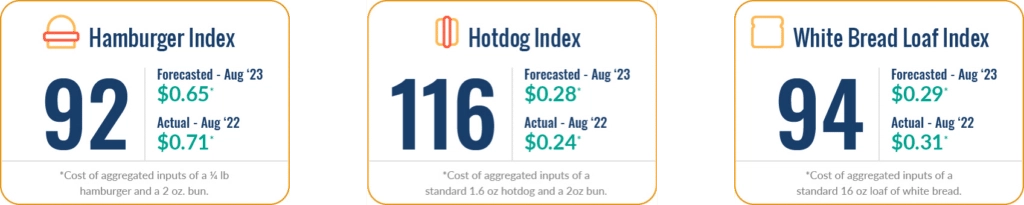 Figure 1 - DecisionNext finished goods indices for August 2023. To see last month’s index, click here.

The White Bread index Deep Dive
Thanks to improving market conditions, the White Bread Loaf Index number is 94 (Fig. 1). Last August, the price was $0.31, and the forecasted price for this August is $0.29**,** which works out to a forecasted 6% drop year-over-year for the month of August (Fig. 2).
**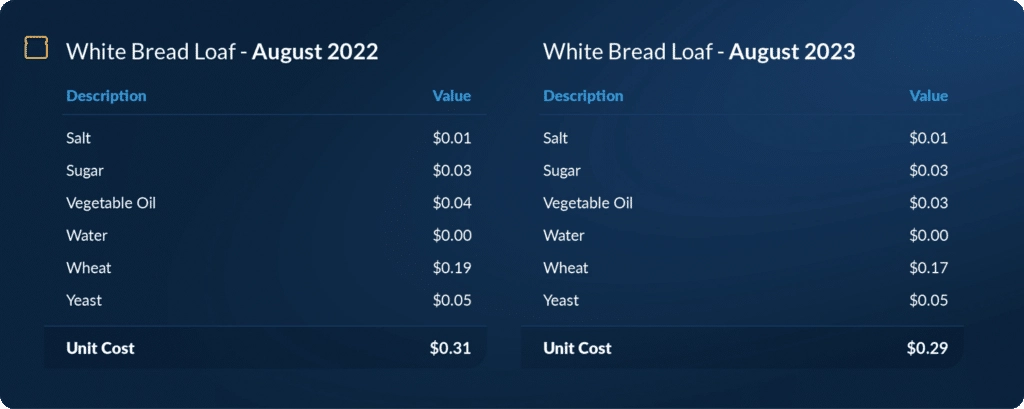 **Figure 2 - White bread load index.
Question is, why is this happening? To get a better understanding of what the future holds, let’s take a quick look at past and current wheat prices.
The Past
Last year, there were several fundamental drivers that all added up and caused the price of grains and processed food prices to skyrocket (Fig. 3). The Ukraine conflict resulted in major global price instability, at a time when inventories were already at low levels from the previous year’s droughts and strong global demand. In the US, high corn and soybean prices continued to incentivize farms away from planting wheat, putting a premium on US wheat relative to global markets. Prices of food were also pressured upward by domestic biodiesel policy changes that increased the price of food oils (for more on soy oil forecasting, read this article).
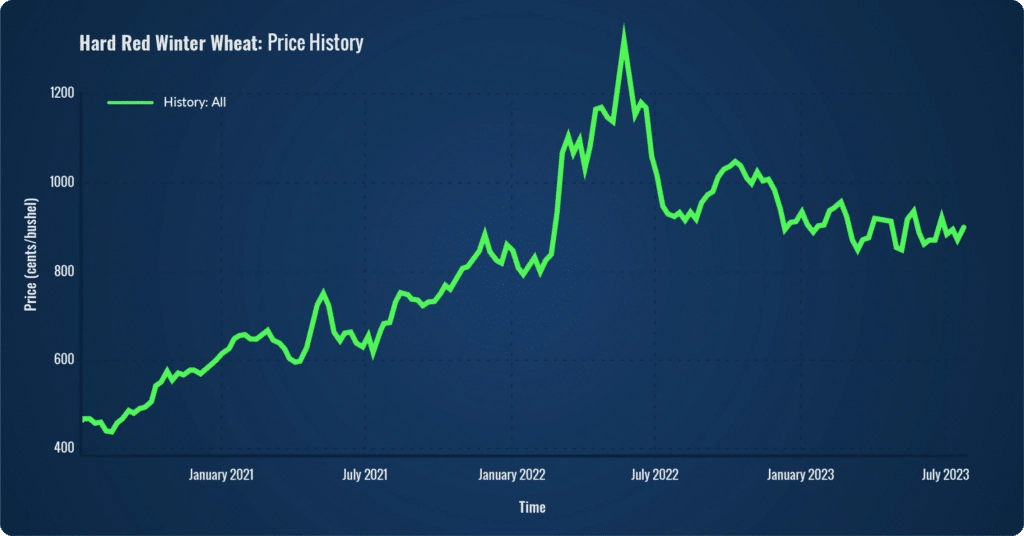 Figure 3 - Hard Red Winter Wheat - price history from January, 2021 through present day.
The Present
In the months after the invasion of Ukraine, the price of US hard red winter wheat (HRW) peaked in June of 2022 (Fig. 3). Prices have since receded from those highs after better-than- anticipated exports out of Ukraine were realized. Strong production in Brazil further helped to push grain prices lower, as well as US policy changes that reduced soybean oil demand for biofuels. Expectations of a strong US production year are currently helping to keep expectations for prices to fall even further. HRW, while down from last year’s highs, has remained higher relative to the declines in other grains, including SRW wheat, over the past six months. The HRW premium continues to stay up in the face of renewed turmoil in the Black Sea.
On top of it all, there’s uncertainty around the Chinese economy. They’re one of the largest importers of grains and meat and that could have a massive ripple effect cascading through global markets.
As of early 2023, our 26 week forecast shows HRW prices remaining steady, a key price driver for white bread (Fig. 4).
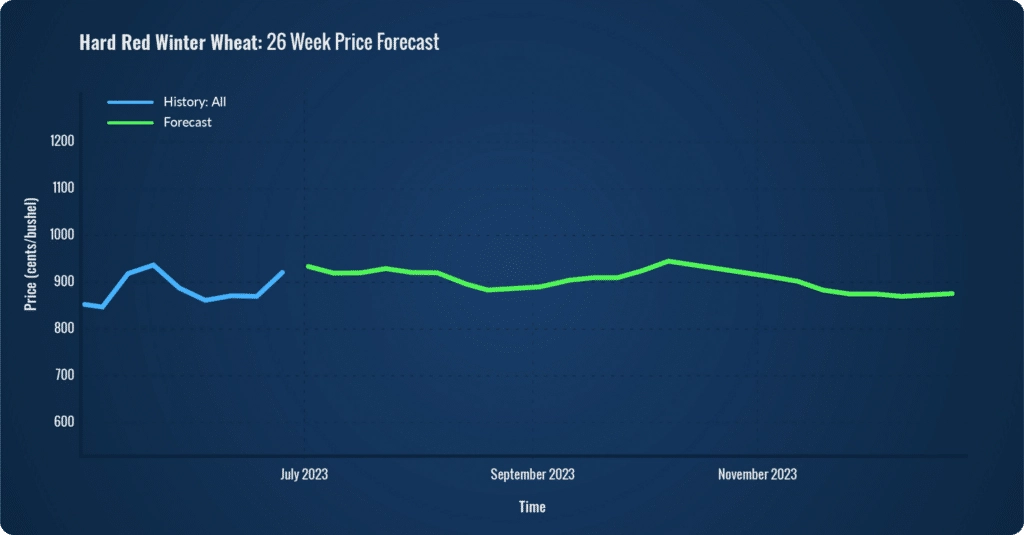 Figure 4 - Hard Red Winter Wheat 26 Week Price Forecast.
Key Takeaways
The fact is there are some things that are simply beyond our control. Political events, policy changes and forces of nature can all add up and have an immediate impact on global markets. While markets seem stable, that could all change in an instant and send grain prices soaring again. That’s why as we move forward, it’s more important than ever to remain vigilant and stay on top of fundamental economic driver variables.
About the Report
Overall, the DecisionNext Finished Goods Index Report showcases the flexibility of our tool’s range of solutions. It offers multi-commodity forecasting consolidated into a single finished goods forecast, the ability to choose the timeframe for the forecast, and the option to customize recipe templates to optimize finished goods profitability.
*How the Indices are Calculated: The index number for each finished good is calculated by taking the forecasted aggregate price for the inputs in July of 2023 and dividing it by the historical aggregate price for those same inputs in July of 2022. Essentially, we are using the tool to forecast the finished goods cost in a future month and then making the YoY comparison to the cost from the previous year.
Sign up for our FREE newsletter The Formula.
Every month you’ll get a Finished Good Report along with a deep dive, so you can start to track important trends over time.