Background
The following is the first part in a two-part series detailing the methods behind DecisionNext’s techniques for modeling crop markets and their associated byproducts. This first part details the methods behind the Machine Learning (ML) forecasting methodologies at DecisionNext.
Techniques for modeling crop markets
Methods for analyzing agricultural crop markets are usually categorized into either supply and demand (S&D) equilibrium modeling or time-series techniques. The S&D approach, which has a long history in economics, segments the market into producers and consumers, each responsive to price changes. An equilibrium price is found where the supply and demand curves intersect. While intuitive and theoretically consistent, applying the technique to predicting markets is problematic for most market participants because it typically requires an aggregation of data up to national and annual levels, leaving the analyst with too infrequent observations given a constantly changing industry. High correlation of prices and yields across crops further add to the challenge. [The value of S&D modeling and how it is used at DecisionNext is presented in the second part of this series]
Time-series methods have developed out of the recognition that, despite being less theoretically intuitive, they are much better at predicting and are frequently more explanatory. The basic idea behind time-series techniques is that prices today and in the past hold information useful for predicting future prices (fig. 1). Particularly in forward-looking crop markets, the price next week, or even three months from now, is likely to observe much the same supply and demand conditions as today.

Figure 1 – Using current and historical pricing information, along with knowledge of supply and demand relationships, a time series model can accurately predict future prices.
Because they are less theoretical, the challenge with time-series techniques becomes selecting which historical prices or variables should be used in prediction or explanation. Historical prices not only embed information about future prices, they also embed information related to other markets and conditions. However, a relationship between two variables does not necessarily mean one will be helpful in predicting the other. For example, even when one variable is intended to be predictive of the other, such as inflation expectations for predicting actual inflation, it might not be that informative for actual future inflation levels because people tend to think inflation will be high only after inflation was already high [see article Inflation and Forecasting Meat Prices].
Machine learning with time-series at DecisionNext
While the term Machine Learning (ML) can take on many meanings, as a statistical concept, it generalizes a basic concept to variable selection techniques. As applied in forecasting, ML means instead of requiring the analyst to select which variables are best for prediction, a ML optimization selects the set of variables based on statistical relationships. A ML process is helpful because it can take away the subjectiveness of variable selection from the analyst. It is also useful in filtering through a large number of candidate variables.
To see how this can be helpful, consider predicting the price of soybeans. One frequently talked about relationship with soybeans is the soybean crush margin (fig. 2), or (crudely) the profit a processor earns after parsing out soybean byproducts. The crush margin is calculated as follows:

Figure 2 -The formula to calculate the soybean crush margin.
An analyst with insight toward the use of the crush margin for prediction would apply it to predicting soybean prices. Though as simple as that sounds, the prior sentence generalized over the topic of which time period for both soybean crush margins and soybean prices. Is a one period lag for crush margin a good predictor of soybeans tomorrow, or maybe the lag is further in the past, such as one week or even one month ago? What about predicting soybean prices three months from today, which time period of crush margin should be used? Which soybean lag should be used as well?
Standard time-series econometrics posit the use of successive lags. Meaning, an analyst would predict tomorrow’s soybean price using today’s soybean price and crush margin. The two-period ahead forecast is predicated on the prediction of tomorrow’s price and the lag relationships of the variables. This modeling specification choice, however, is a perspective toward explanation based on autocorrelations of the data, not necessarily prediction. This technique can embed error with each subsequent forecast because the forecasts of greater distance are conditional on the earlier predictions. Further, it does not tell us which set of lags should be used or which variables to include.
Standard time-series techniques tell us nothing about which variables to include for prediction. Analysts can provide value to the standard toolset by supplying a model with a set of market relevant variables, such as crush margin. However, despite how theoretical or intuitive the variable might be for the series of interest, it might not be predictive. As in the soybean case, crush margin is not all that predictive of soybean price, in part because it is a result of soybean price itself. An analyst can counteract this challenge of which variables to include by evaluating the combinations of many variables.
However, when the prediction model is expanded to consider multiple variables and many combinations of lags, it quickly becomes intractably large. Consider a simple model with four potential control variables, potentially each with four lags, creating sixteen potential variables. Allowing for all possible variable combinations would create 65,535 specification options. The number of model specification choices increases exponentially with each potential variable or lag. When you consider the complexity of agricultural markets, possible model specifications for analysts become intractably large.
ML techniques reduce the candidate set and lag selection to a feasible size. DecisionNext ML optimizations also do it in a way that is not just looking at it from an explanatory perspective but also uses out-of-sample forecast errors as part of the variable selection process. Out of sample testing helps to evaluate model overfitting, as it tests whether relationships observed in portions of the data are consistent with the other sections of the data. This process allows the DecisionNext ML optimizations to uncover relationships that analysts might not have considered but end up being intuitive. For example, in predicting pork rib prices we found the spread between ribs wrapped in polyurethane bags versus ribs in vacuum sealed bags was predictive of prices. The intuition behind this predictive relationship is not that the bag mattered, but that type of bag indicated different segments of the market, specifically foodservice versus retail. Grocers possess more price sensitive consumers and a greater ability to hold inventories. Lower prices for grocers suggests either higher inventories and/or lower demand for ribs. Grocer moves tend to predate moves in the general market. Through the use of the ML optimization, we are able to segment differences in the market useful for prediction.
Applying ML to Crop Forecasts
The idea behind DecisionNext ML forecasts is that an optimal forecasting model starts with a somewhat broad but crop-focused pool of candidate series. The candidate series includes a variety of crop prices from around the world, as well as series-related and within-crop price transformations. A within-crop transformation typically refers to a geographical trading basis between two locations, such as the price spread between two major global soybean export ports: New Orleans, USA and Parana, Brazil (fig. 3). A series-related transformation is calculated either based on a processing relationship or related substitutability between products. Example series-related transformations are soybean crush margin, or alternatively, the spread between crude corn oil and soybean oil prices.
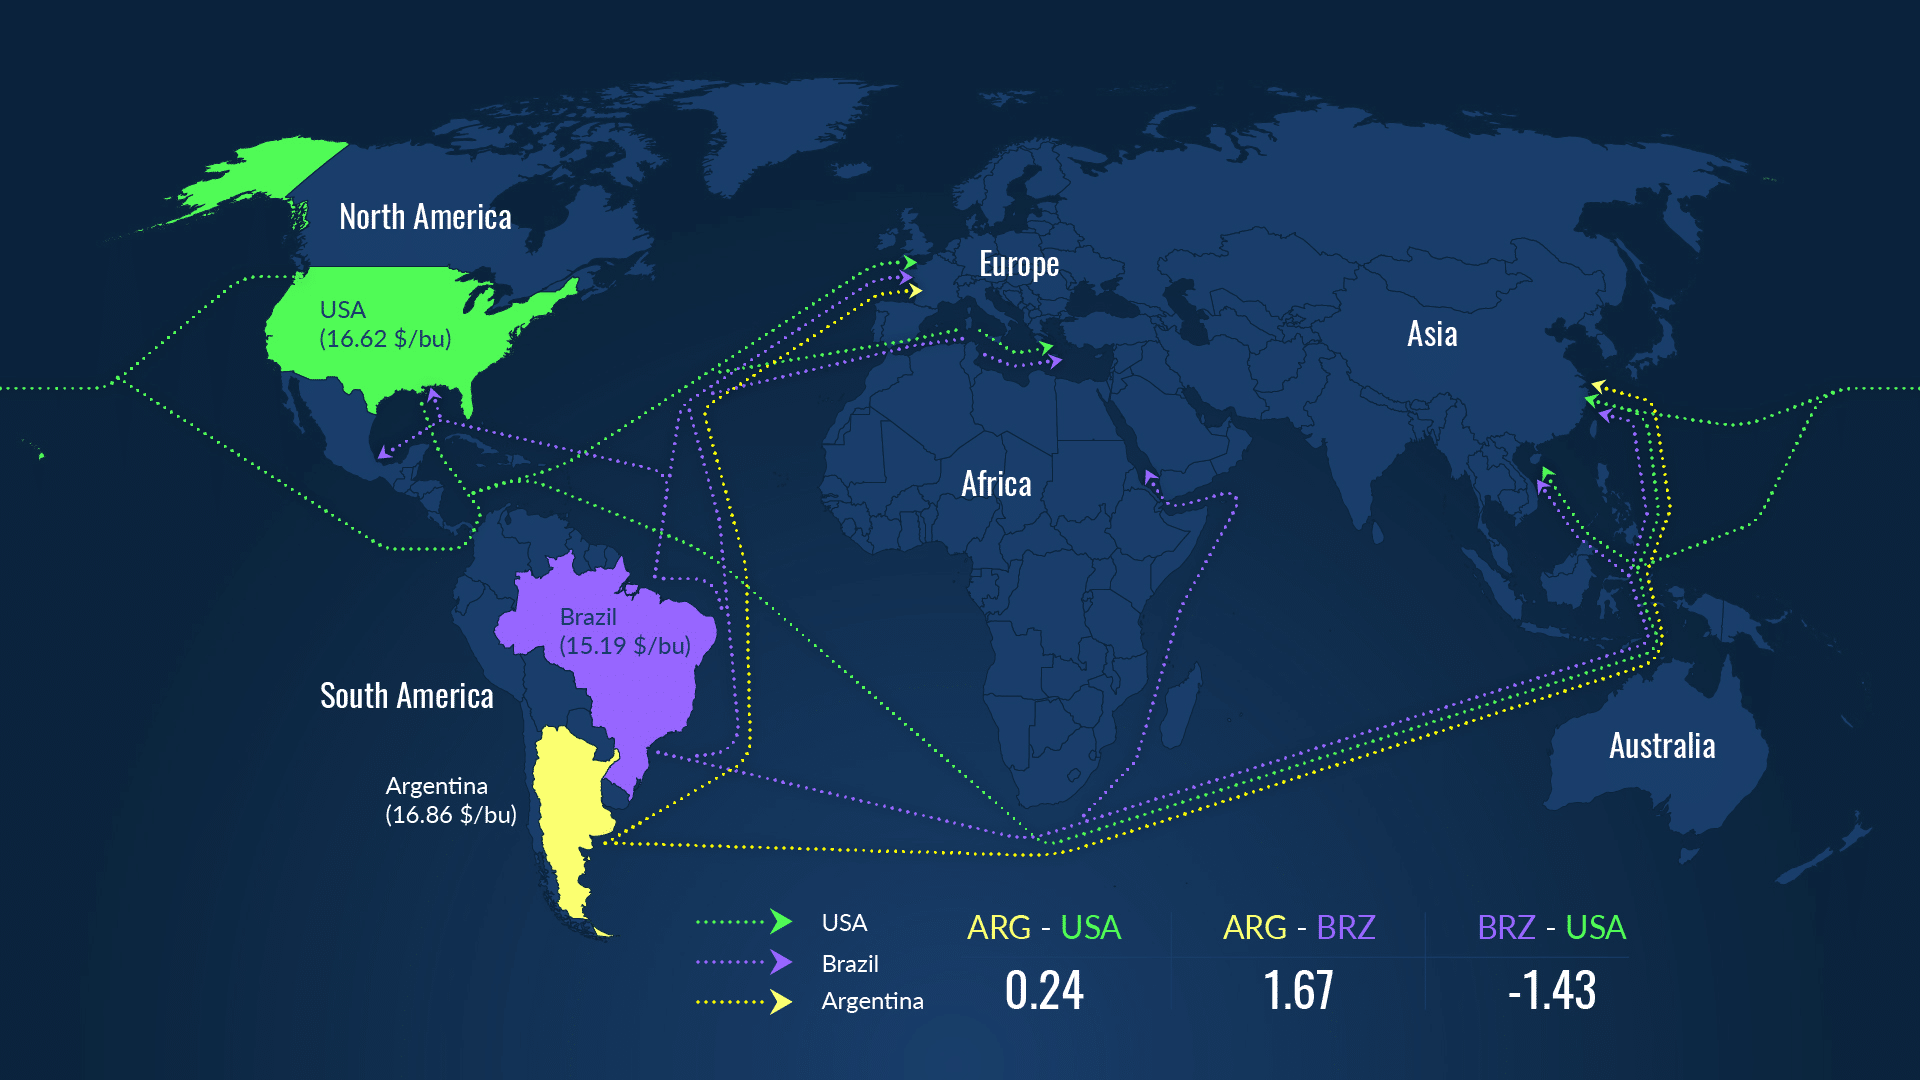
Figure 3 – Soybean trade routes with a corresponding table of price differences.
The thesis behind the set of candidate series relates to the price discovery and integration literature (Yan and Zivot 2010; Janzen and Adjemian 2017; Hasbrouck 1995; Harris, McInish, and Wood 2002). This literature starts from the idea of a perfectly competitive, efficient market with no arbitrage. Under those strict assumptions, the price between the two locations differs only by the transportation cost. In practice, we know that prices can diverge for periods of time but remain commonly linked or integrated. This thesis argues that the divergences from normal price spreads are correlated with future price changes.
Consider a drought in Brazil pushing up the price of domestic corn. The Brazilian price is anticipated to react to its’ domestic supply reduction before the U.S. corn market. However, that initial Brazilian price increase will eventually cause the U.S. spot price of corn to increase because global supplies are down.
Given the substitutability and transportability of crops and their by-products, the divergences from normal conditions or expected outcomes provide signals for prediction. Instead of just looking at one or two price spreads or imbalances, the DecisionNext ML technique draws from a large pool of candidate series to find which ones have been predictive and explanatory in the past so that they can be used for prediction.
One common critique against time-series modeling for commodity market prediction is that it only looks at historical data. An analyst staying on top of the market can incorporate information that cannot be captured in a mathematical model. While this is partly true, the past holds more information in a forward-looking market than one might expect. Consider the role of grain elevators in setting prices today. Expectations of future supply and demand conditions relate closely to spot prices today. So much so that if drought is expected, inventory holders tend to hold back supply today in anticipation. This forward expectation is built into today’s spot price. Thus, it contains more information about the future than one considers at first glance.
One real advantage of ML as a tool is that rather than looking at S&D modeling like every other trader, it is looking through hundreds of series to find explanations of markets through price signals. Providing a perspective unavailable to most traders. Though a ML model might not be able to scenario model the hypothetical effects of a drought in South America or the expansion of oil demand from renewable biodiesel, frequently, those outcomes are shown in data before they hit futures markets. Aside from catching market shifts faster, a ML forecast also analyzes those relationships through actual mathematical measurements instead of commentary. This gives analysts a better understanding of how to weigh past and future market changes.
While S&D modeling remains an essential tool within an analyst’s belt, the DecisionNext ML forecasts provide a 100% mathematically derived forecast that frequently outperforms futures market pricing [see article Forecasting Soy Oil with DecisionNext]. This helps analysts and traders better understand the directionality of markets and sheds light on their and the market’s biases.
Citations
Harris, Frederick H. deB, Thomas H. McInish, and Robert A. Wood. 2002. “Security Price Adjustment across Exchanges: An Investigation of Common Factor Components for Dow Stocks.” Journal of Financial Markets 5 (3): 277–308.
Hasbrouck, Joel. 1995. “One Security, Many Markets: Determining the Contributions to Price Discovery.” The Journal of Finance 50 (4): 1175–99.
Janzen, Joseph P., and Michael K. Adjemian. 2017. “Estimating the Location of World Wheat Price Discovery.” American Journal of Agricultural Economics 99 (5): 1188–1207. https://doi.org/10.1093/ajae/aax046.
Roberts, Michael J., and Wolfram Schlenker. 2013. “Identifying Supply and Demand Elasticities of Agricultural Commodities: Implications for the US Ethanol Mandate.” The American Economic Review 103 (6): 2265–95.
Stock, James H., and Francesco Trebbi. 2003. “Retrospectives Who Invented Instrumental Variable Regression?” The Journal of Economic Perspectives 17 (3): 177–94.
Yan, Bingcheng, and Eric Zivot. 2010. “A Structural Analysis of Price Discovery Measures.” Journal of Financial Markets 13 (1): 1–19.

