The DecisionNext Finished Goods Index Report | January 2026
Published: January 14, 2026
Key Insights
- The Finished Goods Index has rolled its base year from 2024 to 2025
- Cheeseburger prices are projected to rebound toward 2025 highs by summer
- Hot Dog index shows a muted recovery into early summer
- Chicken Sandwich forecast signals a spring rally after months of decline
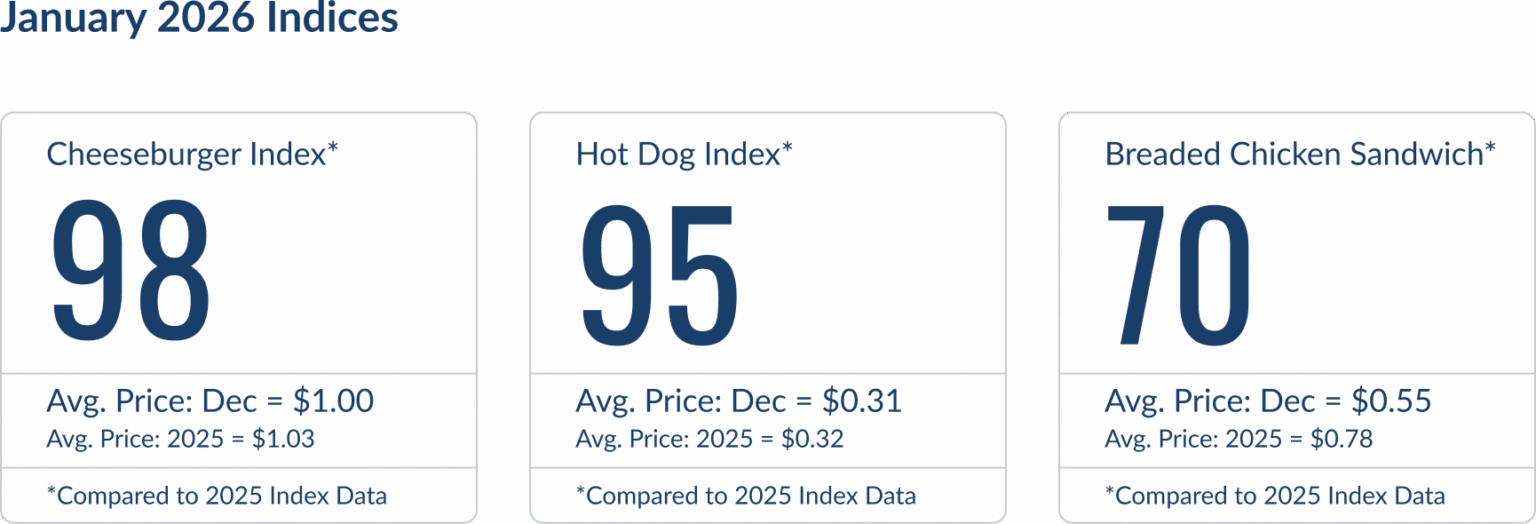
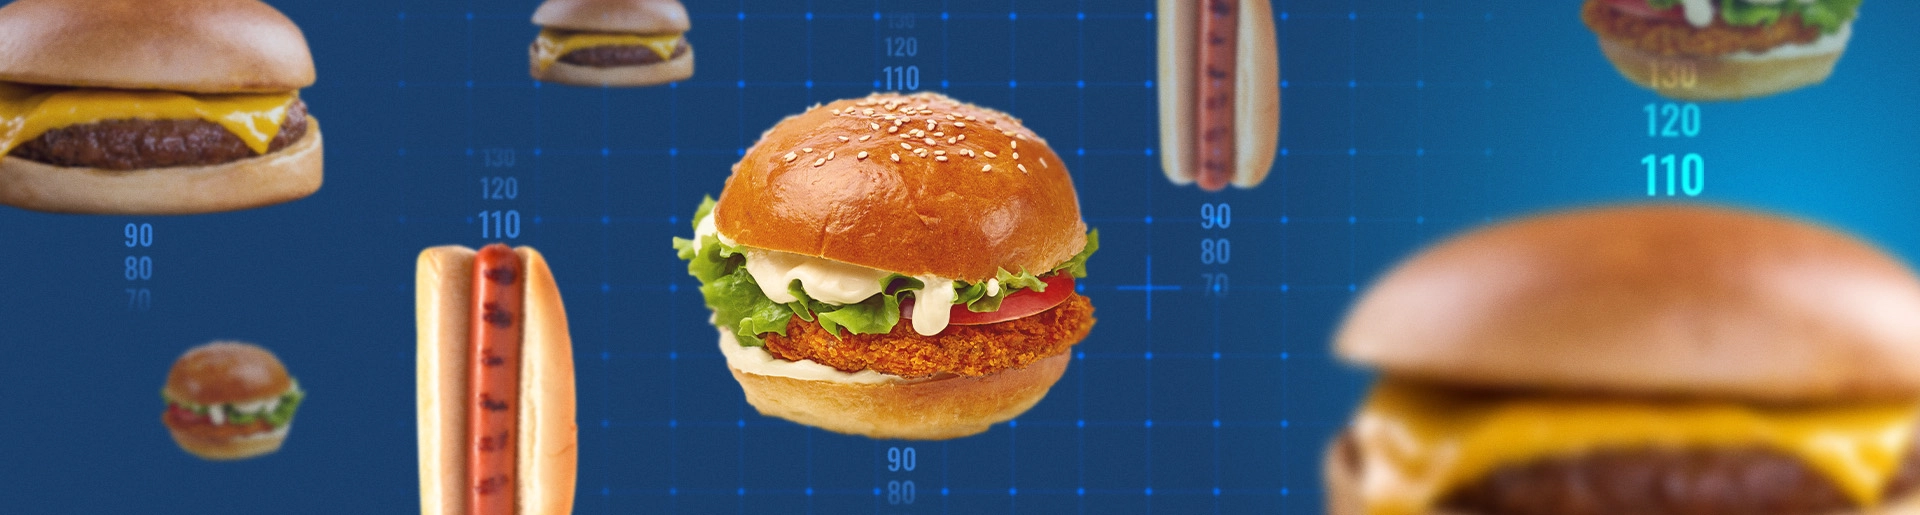
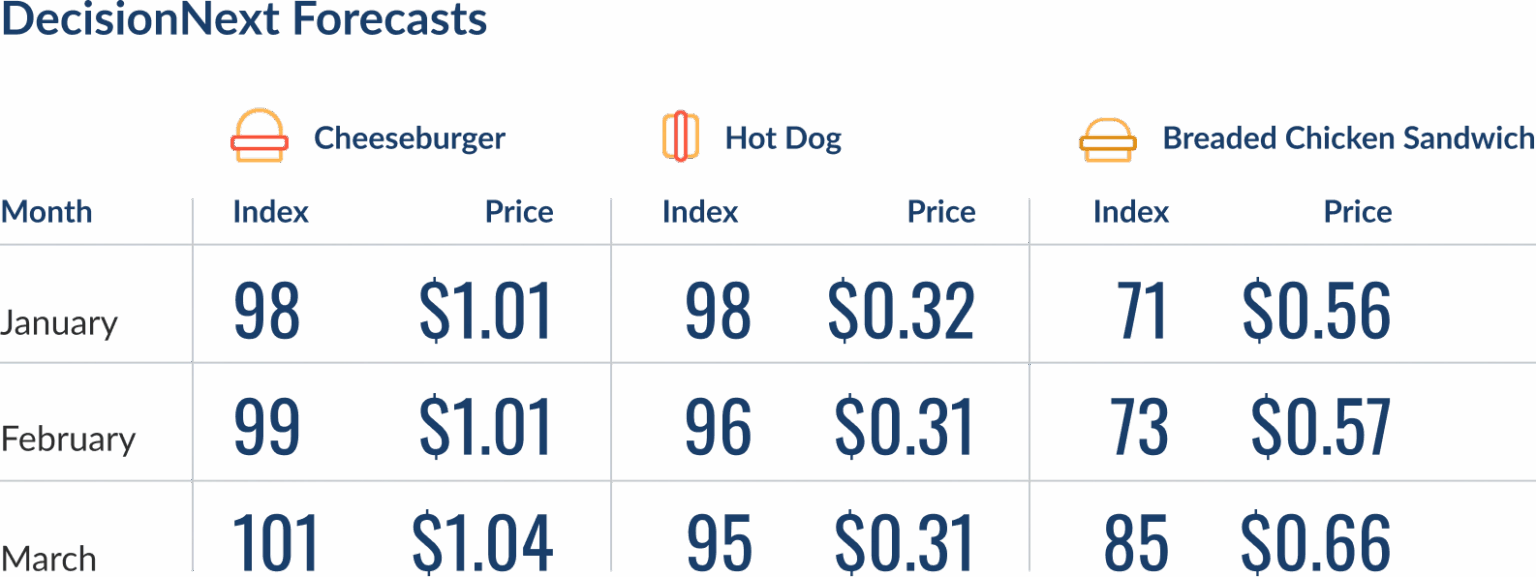 Figure 1 - With Cheeseburger steady, Hot Dog elevated, and Fried Chicken Sandwich correcting sharply, DecisionNext now provides full cross-protein insight.

The Rollover to 2025 as the New Base Year
As the calendar flips to 2026, the DecisionNext Finished Goods Index (FGI) has completed its annual rollover, updating its base year from 2024 to 2025.
This methodological update ensures ongoing analytical accuracy by benchmarking the index against the most recent full year of pricing data.
The DecisionNext FGI calculates the value of a fixed basket of finished goods using current prices and compares those values to a fixed base year. With the transition to 2026, the base year now reflects 2025 average prices, derived from roughly 48 weekly observations per product across the year.
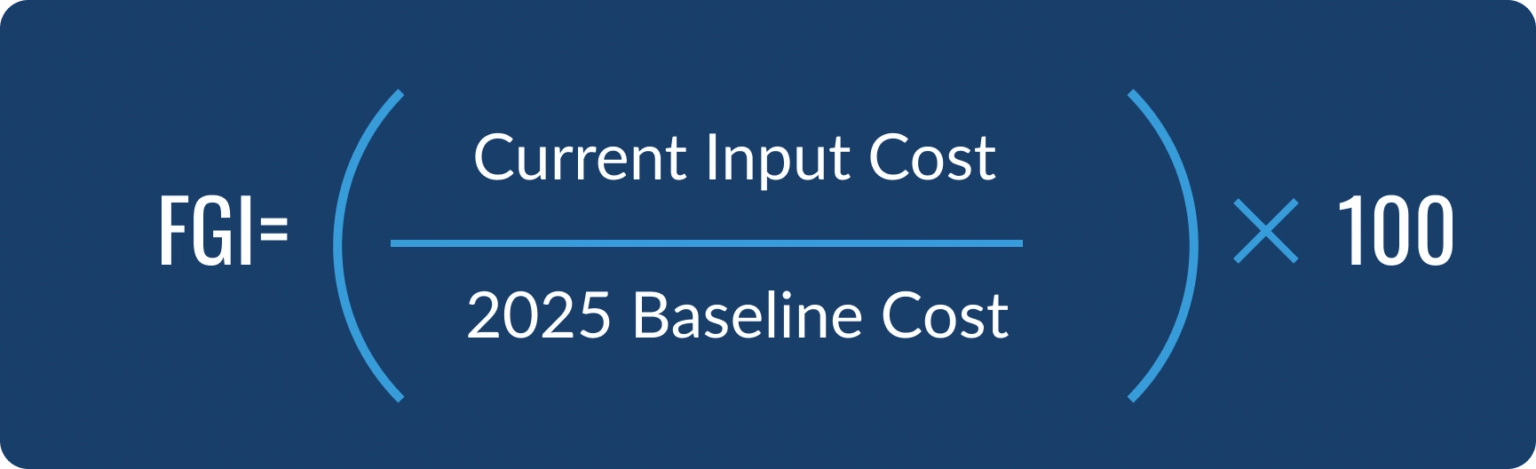 Figure 2 - Equation used to calculate the DecisionNext Finished Goods Index, updated for the new base year.
Additionally, the chicken sandwich calculation was refined to better reflect consumer-facing pricing. A pricing transformation was applied to the bun input to correct historically understated costs tied to flour market proxies.
Finished Goods at a Glance: 2025 Review and 2026 Outlook
The Cheeseburger peaked at $1.16 in July 2025 and currently sits near $1.00.
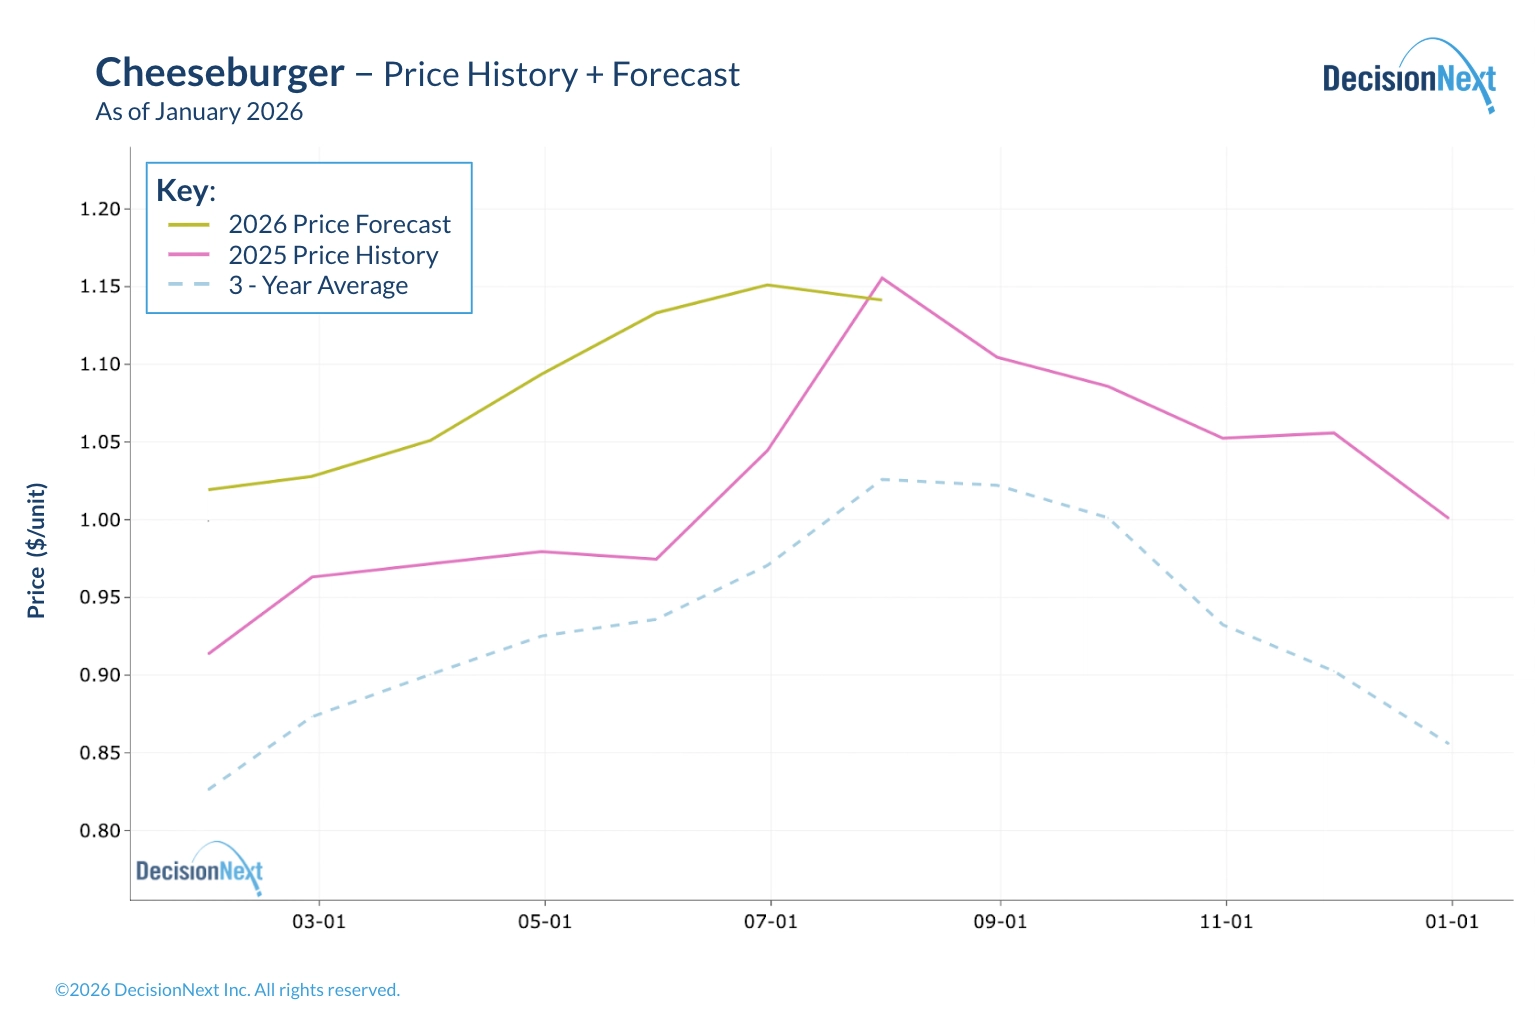 Figure 3 - Cheeseburger price history and 6-month forecast.
Looking ahead, cheeseburger pricing is expected to climb into mid-2026, potentially reaching parity with 2025 highs near $1.15, well above the three-year average. The projected rise in 90CL trim remains a primary driver.
The Hot Dog index followed a similar seasonal pattern in 2025, peaking at $0.41 in July before settling at $0.31 by year-end.
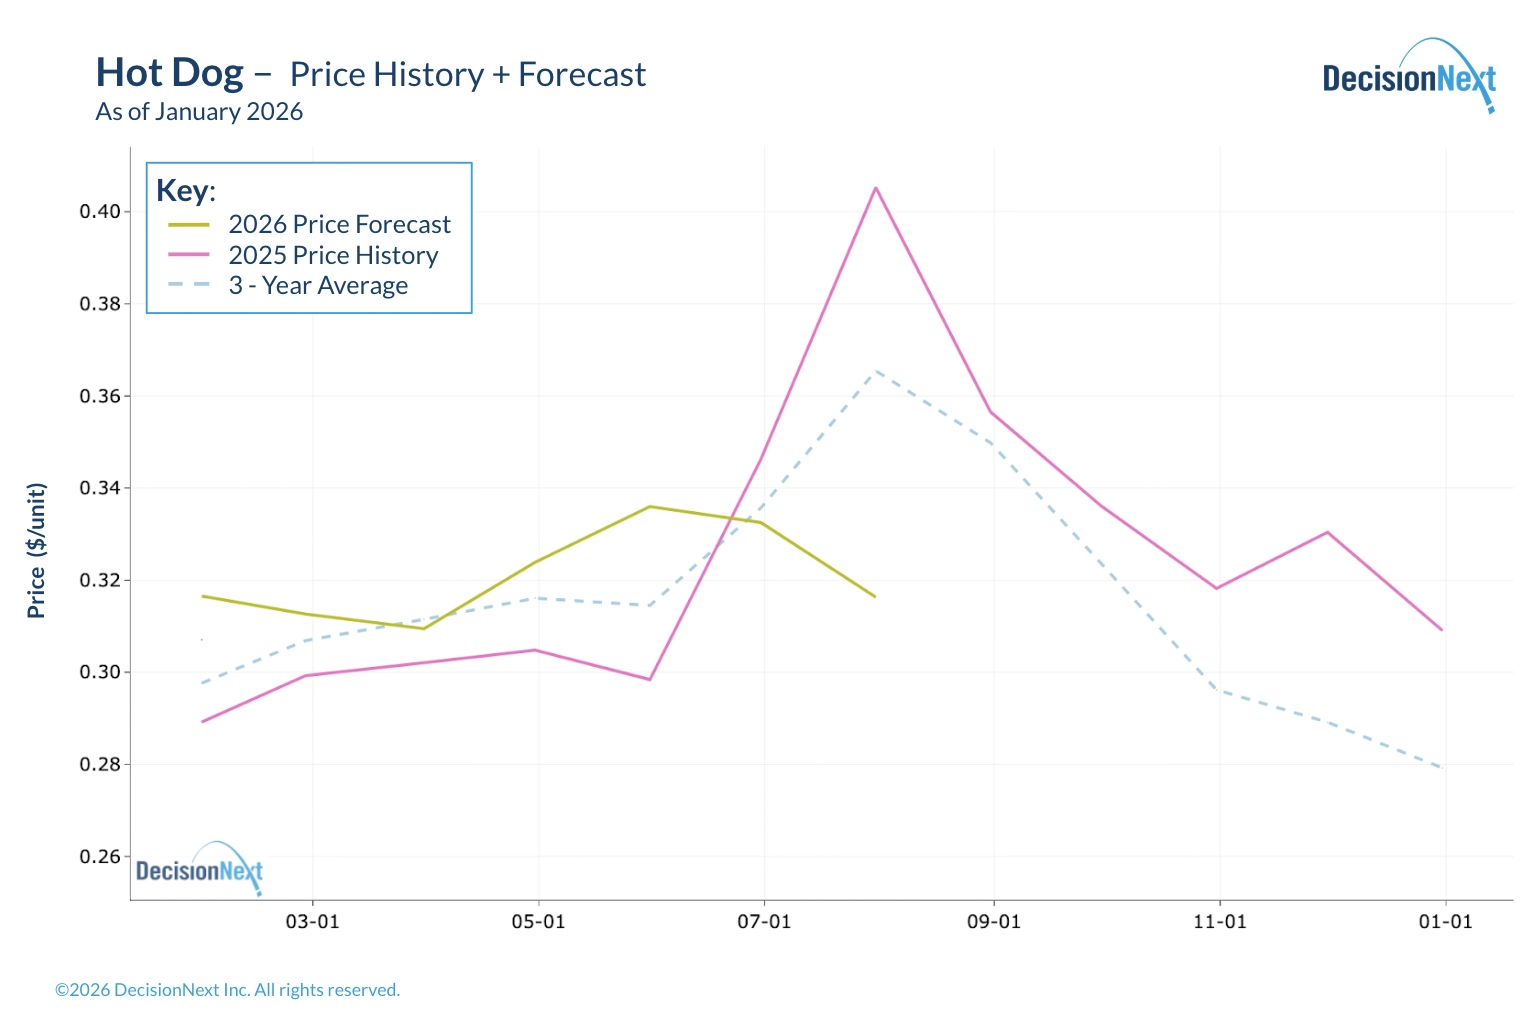 Figure 4 - Hot Dog price history and 6-month forecast.
For first-half 2026, prices are forecast to rebound modestly through spring, peaking near $0.34 in May before easing in early summer. Relative pork softness continues to cap upside versus mid-2025 highs.
The Chicken Sandwich index spiked in May 2025, then dropped to $0.54 by October.
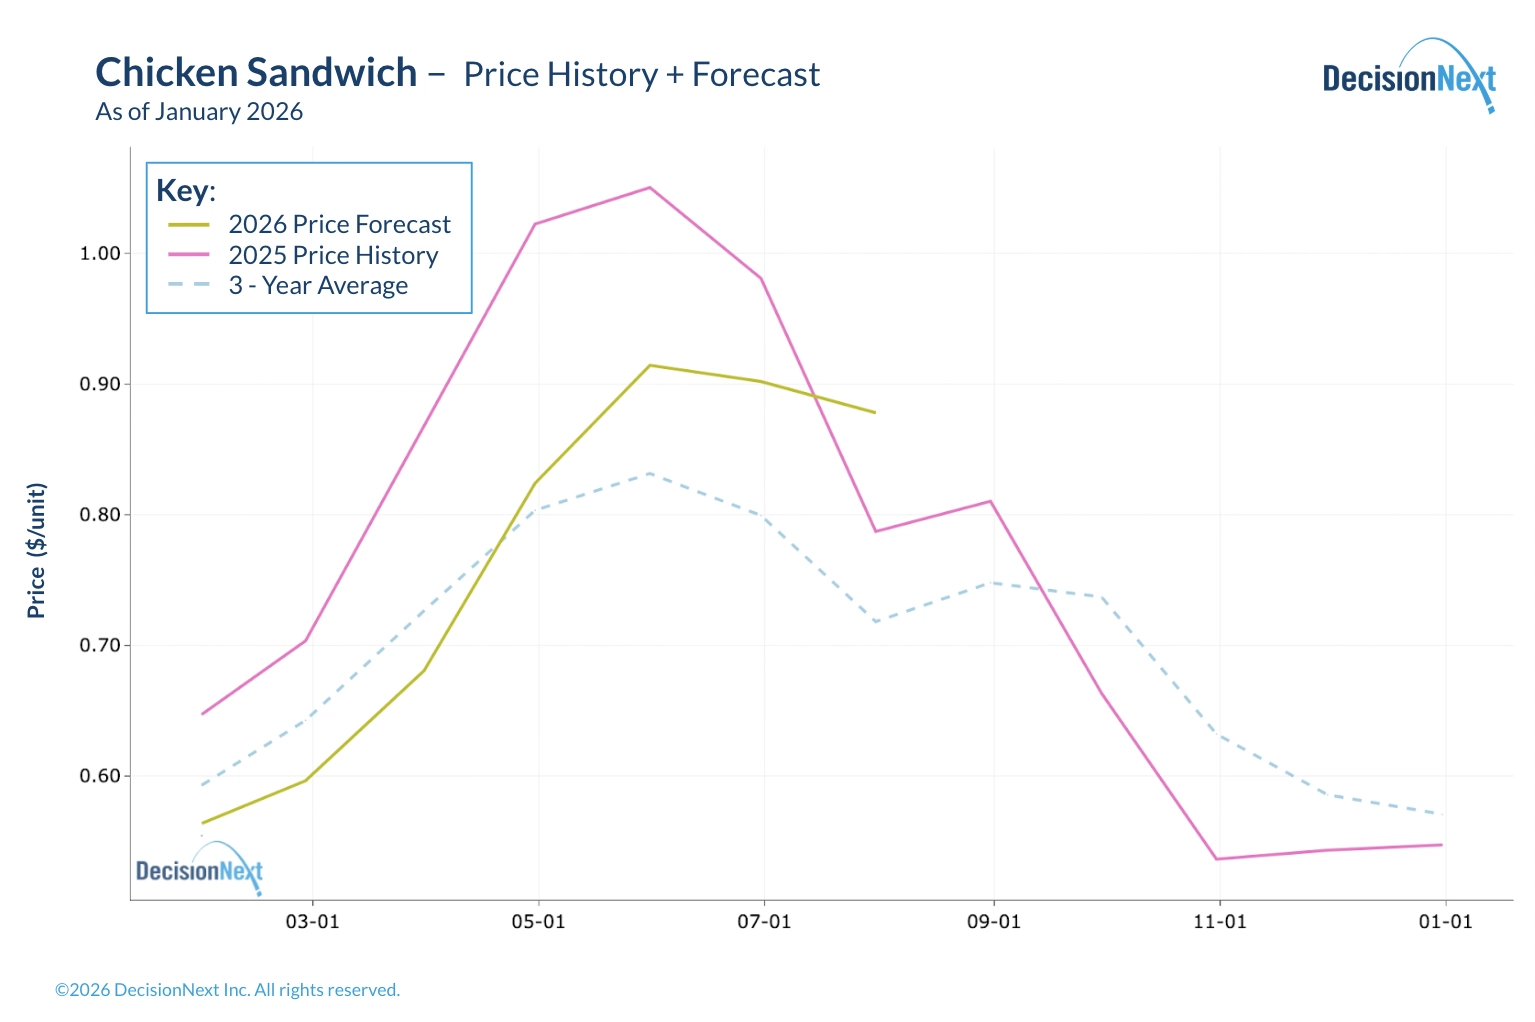 Figure 5 - Chicken Sandwich price history and 6-month forecast.
As 2026 begins, chicken sandwich values are forecast to rally above $0.80 by June, supported by seasonal poultry demand and the refined bun-cost adjustment.
What It All Means for You
For stakeholders navigating volatility and planning for the year ahead, the 2026 rollover is more than a technical update. It is a refreshed benchmark that realigns analysis with current market realities.
Cheeseburgers, hot dogs, and chicken sandwiches are now moving in different directions, each shaped by distinct market forces: tightening beef trim supply, softer pork pricing, and a resurgent poultry sector.
The DecisionNext FGI’s recipe-based approach combines key ingredients across multiple commodity sectors into one unified model. That breadth helps decision makers understand not only what prices are doing, but why.
For teams managing supply chains, setting menu prices, or planning promotions, the recalibrated FGI supports more accurate forecasts and better-aligned pricing strategies. DecisionNext will continue improving methodologies to provide clearer insight and foresight.
Want to see the data behind this forecast or run your own analysis? Connect with DecisionNext or access the platform today.
About the Report
The DecisionNext Finished Goods Index showcases multi-commodity finished goods cost forecasting across protein, dairy, grain, and ingredient markets (see full methodology page).
By comparing current values to the average value from 2025, it helps stakeholders visualize real-time and forward cost pressures and profit opportunities across value-added food products. The tool enables users to forecast finished-good costs, adjust recipes, and analyze forward-looking scenarios.