Hog Prices No Longer Tell the Whole Story

Published: November 10, 2025
If you’re buying pork for a processing plant, distribution center, or foodservice operation, you’ve probably noticed something: the relationship between live hog prices and individual pork cut prices isn’t what it used to be.
Some cuts track hogs closely. Others seem to operate in their own universe. That variability creates a forecasting problem.
The question isn’t whether you need better forecasts. It’s whether you’re using the right forecasting approach for each cut you’re buying. The data shows one model can’t do it all.
Why Correlation Matters
Some pork cuts track closely with live hog prices. Others don’t. Understanding this relationship tells you whether a hog-based forecasting model will work for a given cut or whether you need a different approach.
Visually, correlation is easy to spot: when two price lines track together on a chart, correlation is high. When they diverge or move independently, correlation has broken down.
To understand how this plays out in practice, we examined four specific pork price series, each representing one of the four major pork primals: ham, loin, rib, and trim. We selected the highest-volume traded cut from each primal according to USDA data.
The Four-Cut Analysis: What the Data Shows
We analyzed these three major cuts plus a trim series, tracking them from 2022 through mid-2025 and comparing their prices to the CME Lean Hog Index. The results show dramatically different correlation patterns across primals and different forecasting needs depending on which category you’re buying from.
72% Trim Combo: The Reliable Follower
Trim tracks hog prices more consistently than any other cut in our analysis. From the 2022 price spike through the 2023 correction and into 2025, trim and hogs move in near-lockstep.
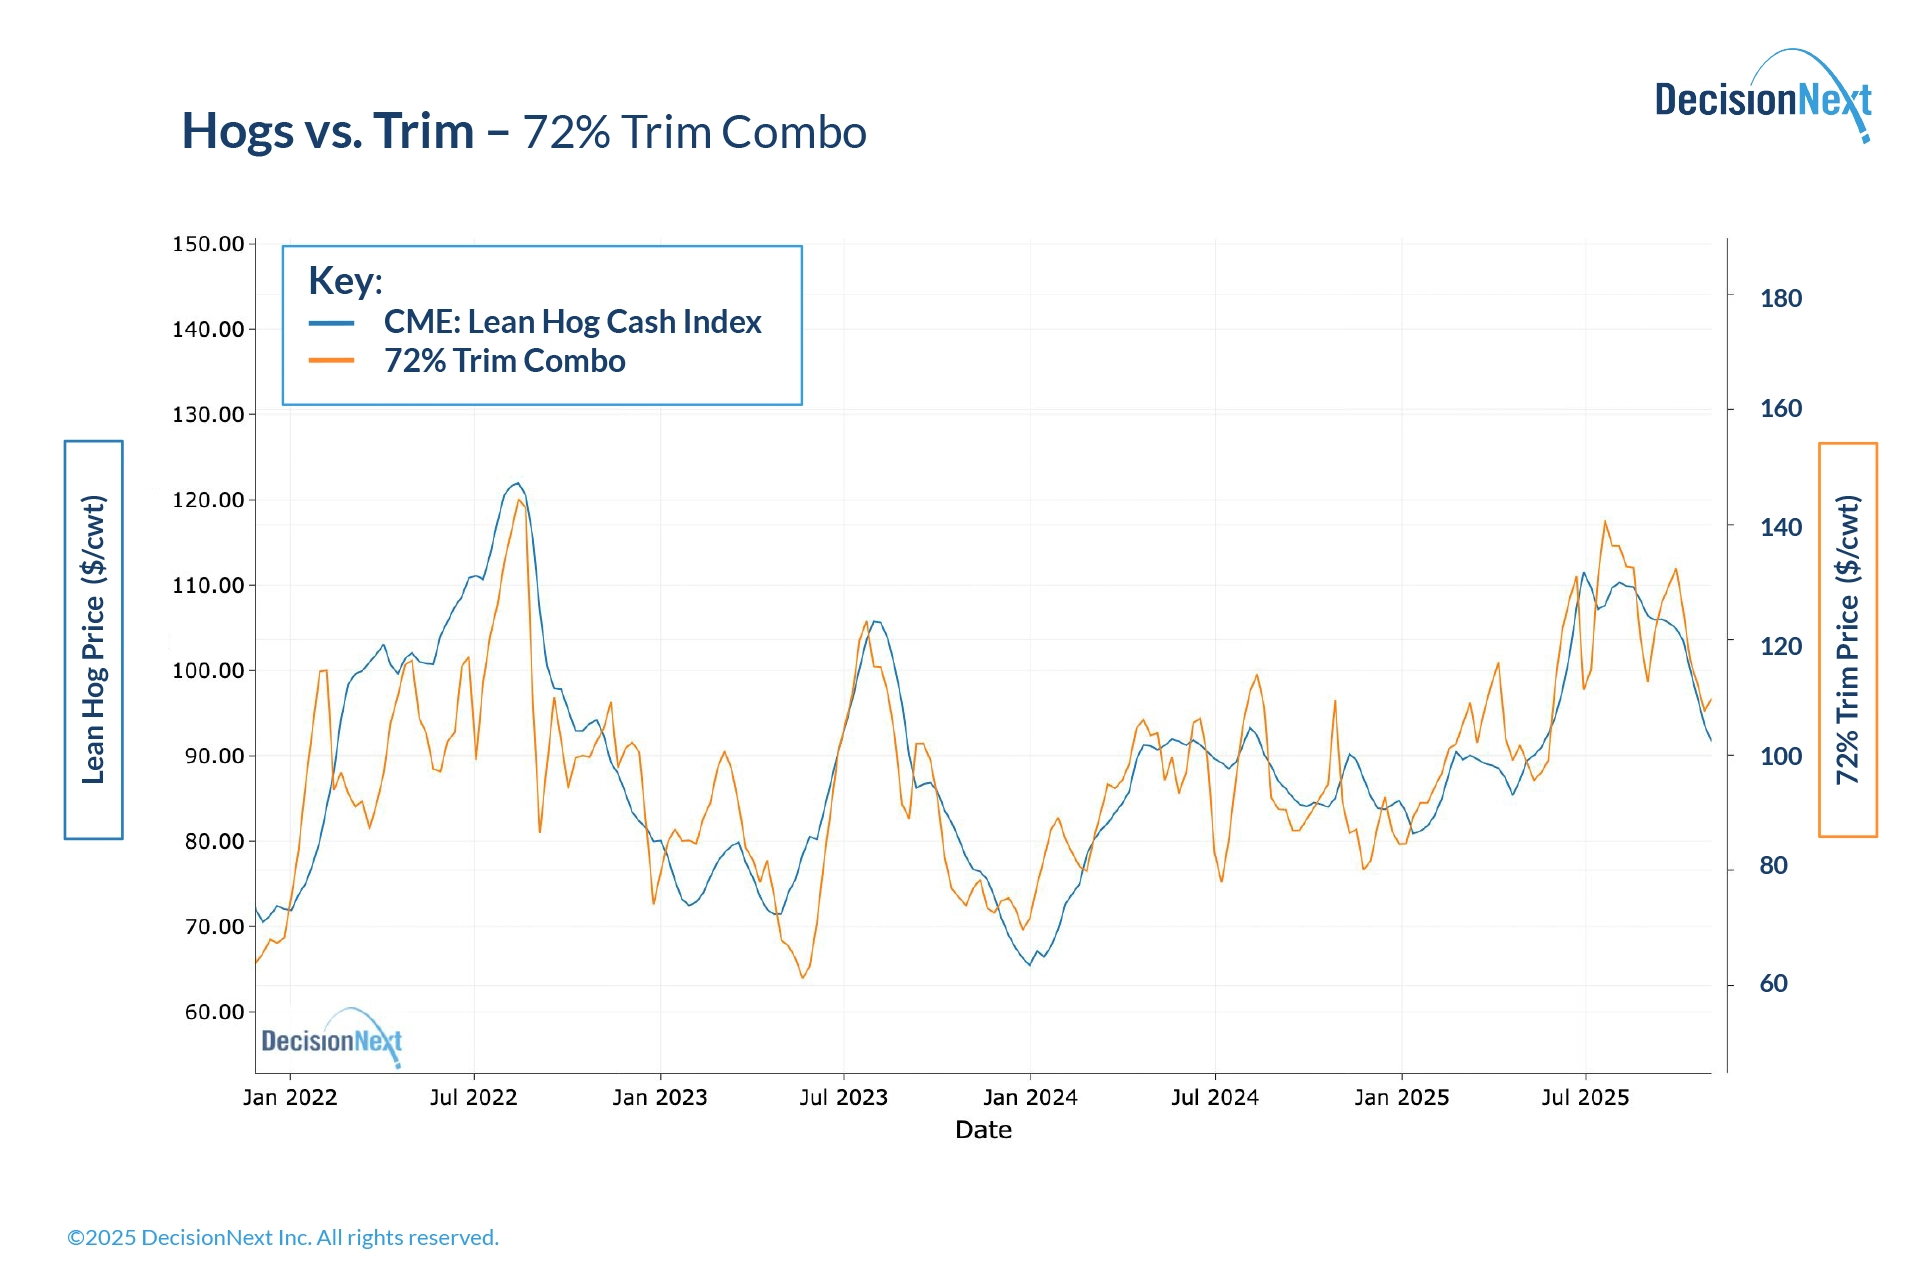 Figure 1 - CME Lean Hog Index vs. 72% Trim Combo (2022-2025).
This makes intuitive sense. Trim is a commodity input used primarily for ground pork and sausage production. Its value is driven by overall pork supply rather than specific consumer demand for a branded retail cut.
When hog supplies tighten, trim prices rise. When supplies loosen, trim falls. The relationship is direct and stable.
Forecasting implication: Hog-based models work well here. If you’re buying trim, anchoring your forecast to CME futures or cash hog fundamentals will give reliable directional guidance over the medium and long term. Short term, meaningful divergences can still present buying and selling opportunities.
23-27# Selected Ham: The Amplified Follower
Ham generally follows hog price trends but with higher volatility. In mid-2022, hog prices spiked, but ham prices spiked even more dramatically and remained elevated longer. In early 2023, when hogs corrected downward, ham crashed harder.
Through 2024, the two series tracked closely, but ham’s moves were consistently larger in magnitude.
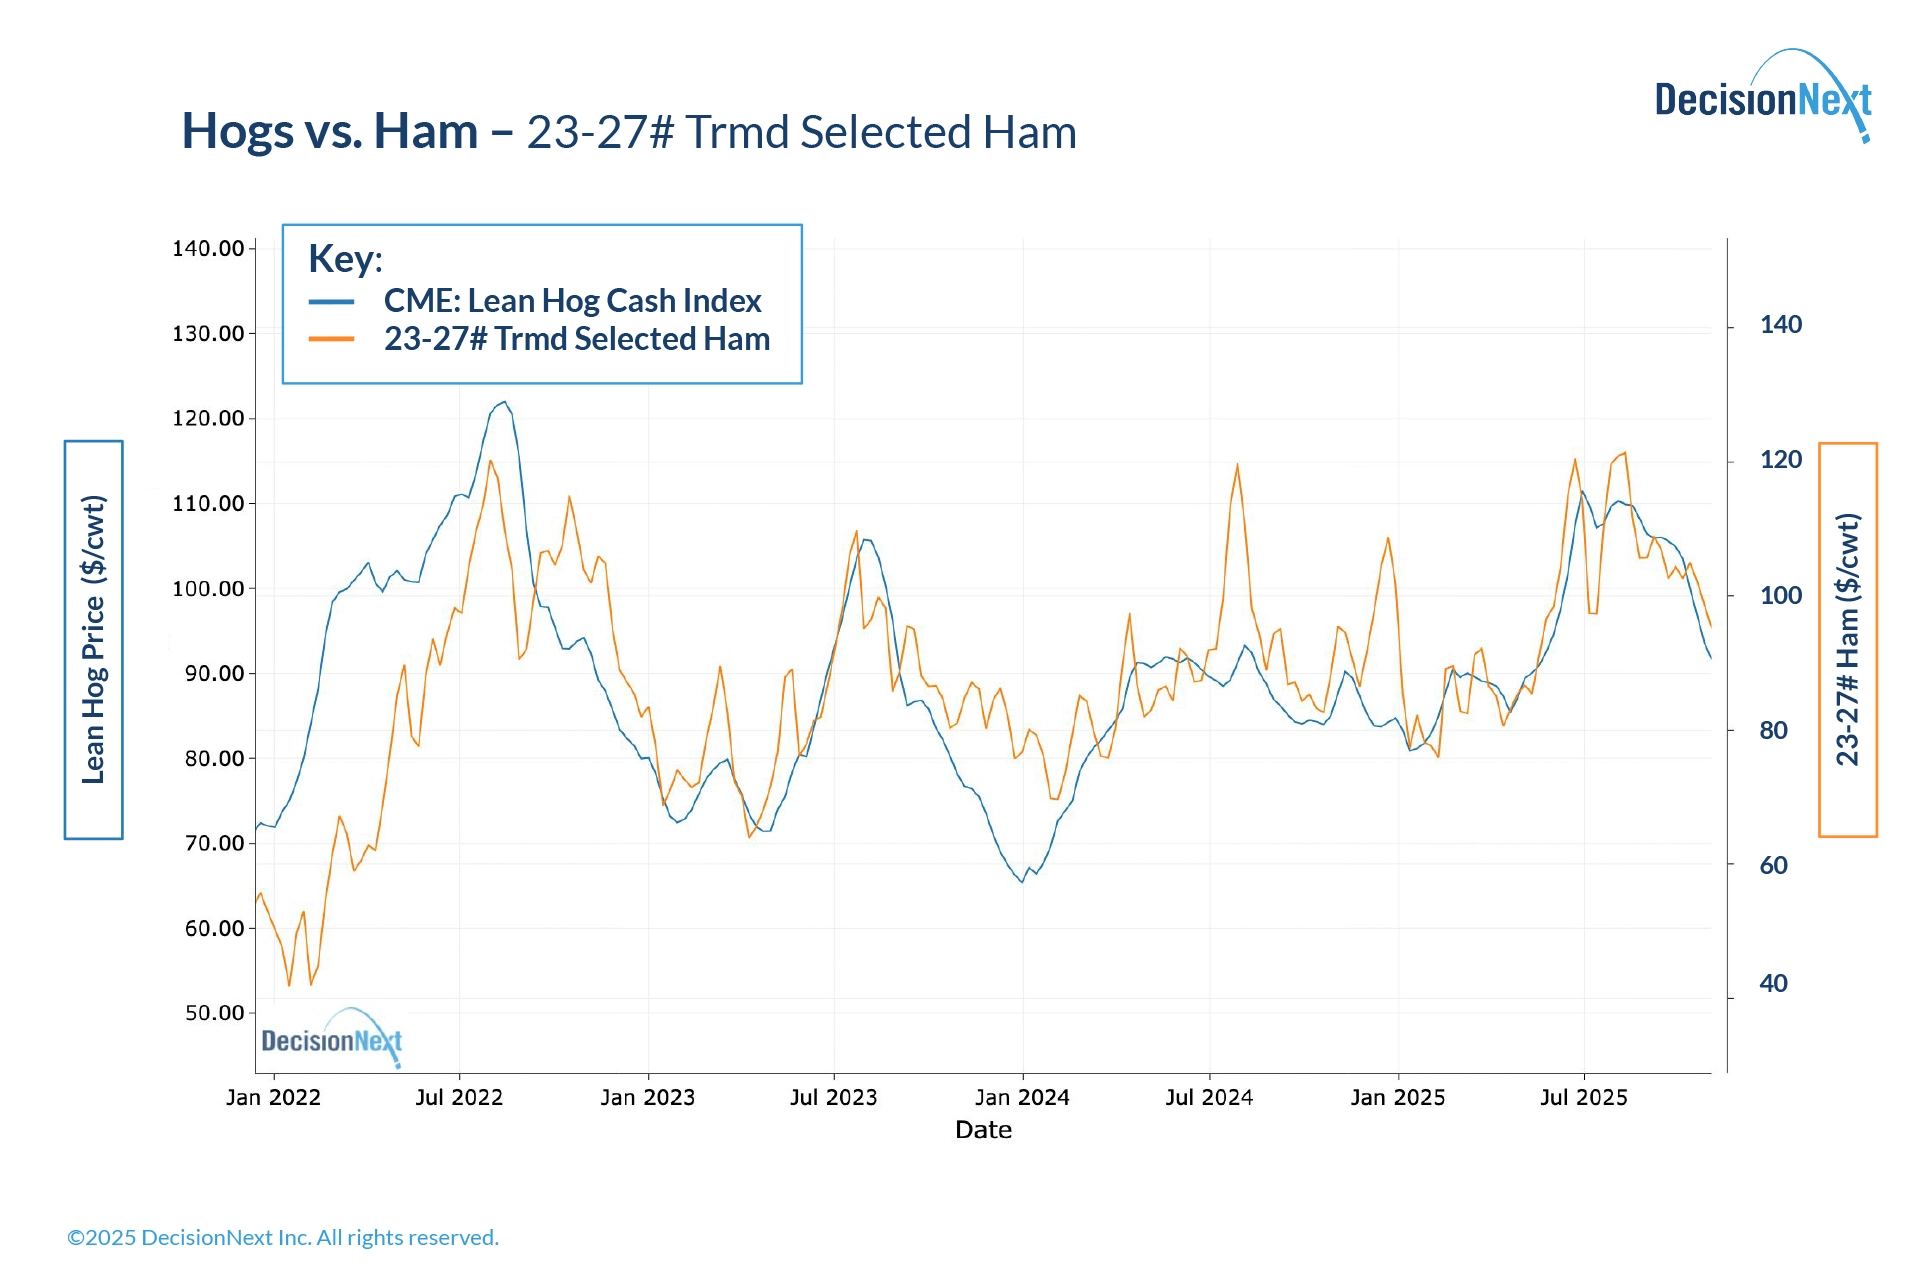 Figure 2 - CME Lean Hog Index vs. 23-27# Selected Ham (2022-2025).
This amplification reflects ham’s exposure to seasonal demand cycles, particularly holiday peaks, and export market dynamics. Ham isn’t just a generic pork input; it’s a destination product with its own demand drivers.
When those drivers align with hog fundamentals, correlation strengthens. When holiday buying or export shifts dominate, ham decouples and overreacts.
Forecasting implication: Hog-based models provide a useful baseline, but you need cut-specific factors layered in, especially seasonal adjustments and export demand signals.
Sparerib MED: The Seasonal Drifter
Spareribs show the most variable correlation pattern of the four cuts. In early 2022, spareribs tracked hogs reasonably well. Then hog prices spiked while sparerib prices dropped seasonally. From late 2022 through 2023, the series tracked closely again.
The two series diverged significantly in the summers of 2024 and 2025.
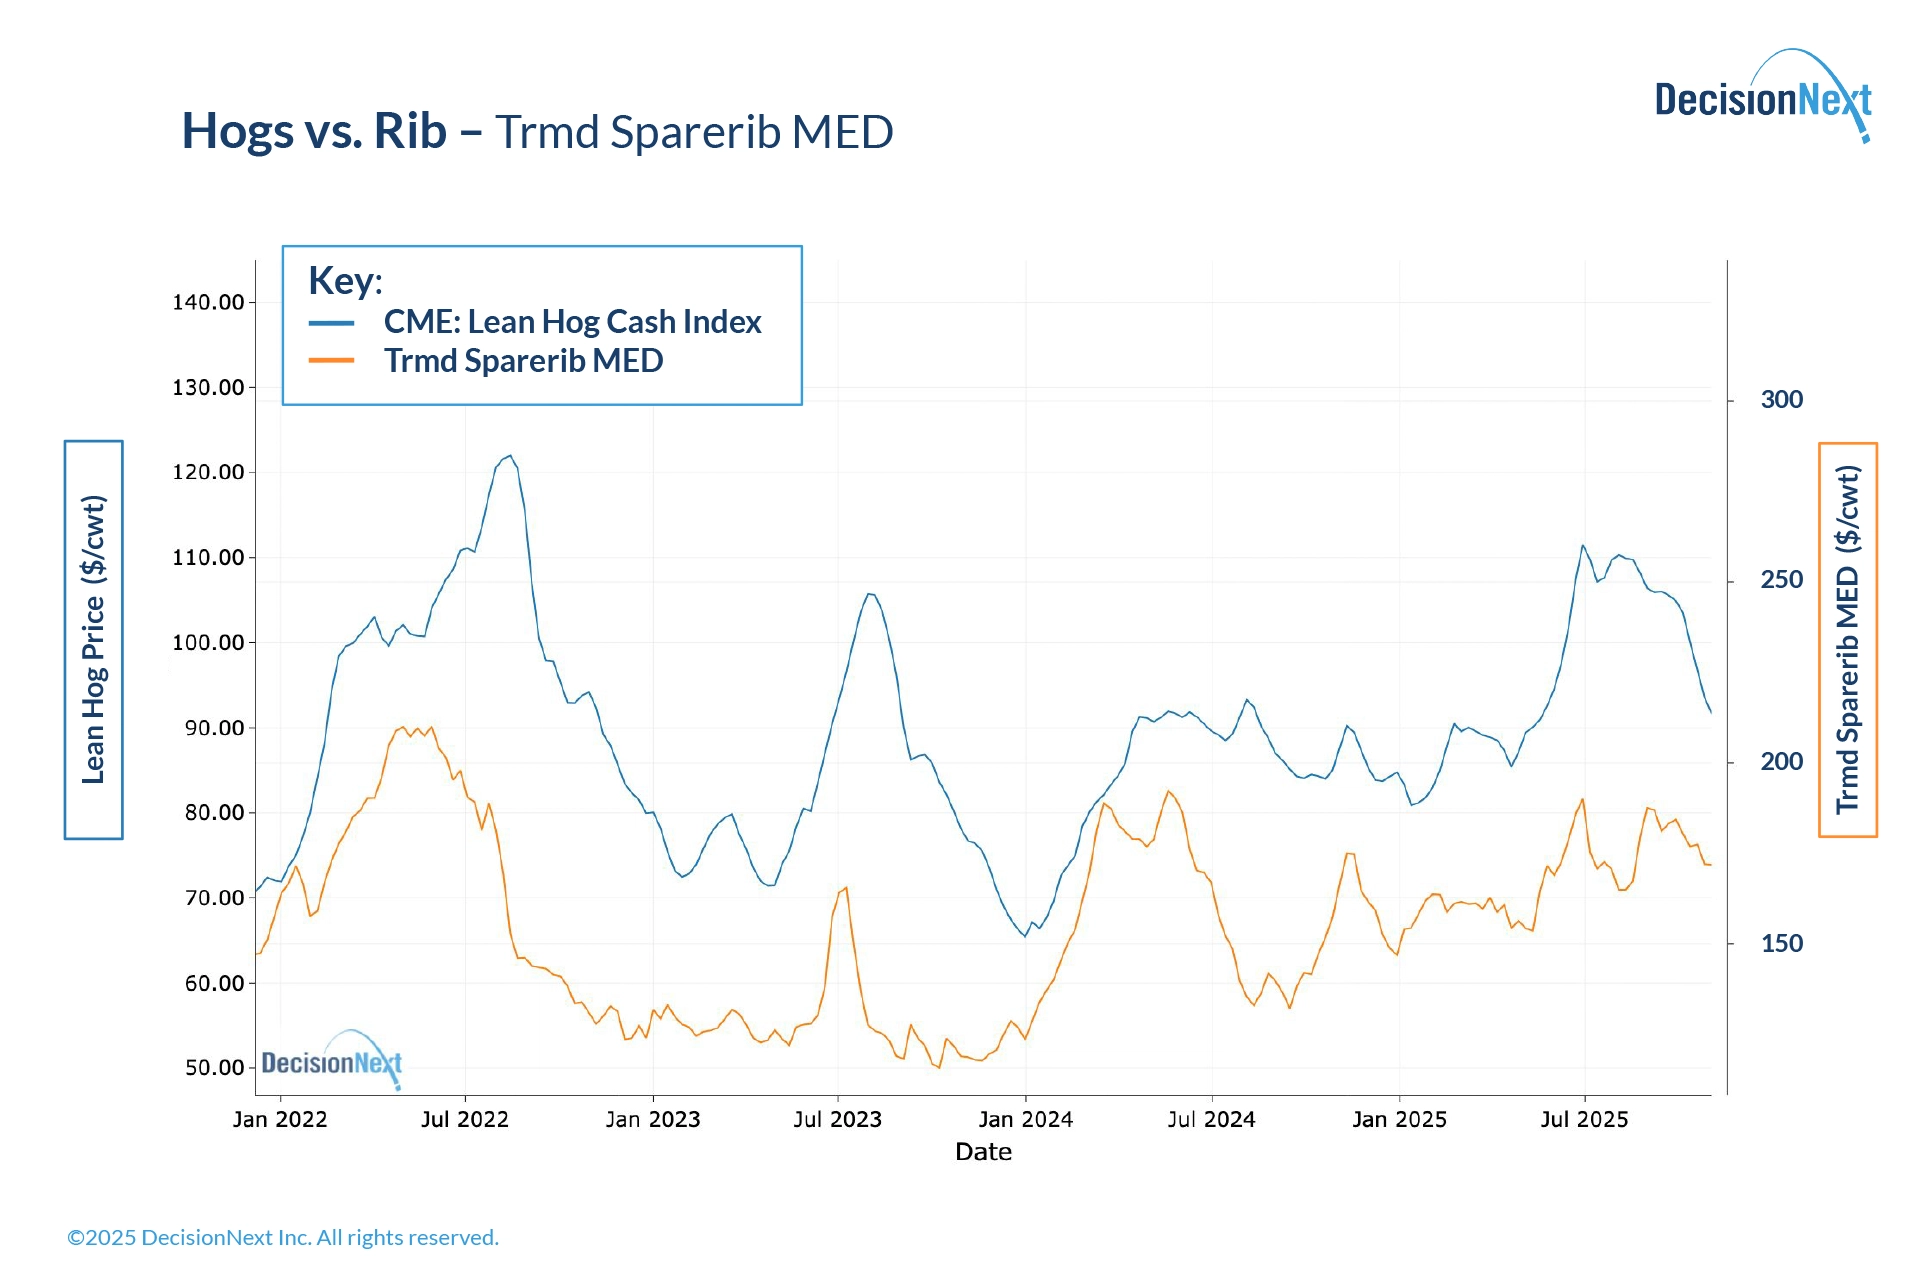 Figure 3 - CME Lean Hog Index vs. Sparerib MED (2022-2025).
This variability reflects spareribs’ strong seasonality. BBQ season drives rib demand in ways unrelated to overall pork supply. When grilling demand is strong, ribs decouple upward. When foodservice sales soften outside peak season, ribs can drift lower independent of hog moves.
Forecasting implication: You can’t rely on one model year-round. During strong correlation periods, hog-based forecasts work. During decoupling periods, which can last months, you need alternative approaches that capture rib-specific demand patterns.
Boneless CC Strap-On (Loin): The Independent
Loin cut prices show minimal relationship to hog prices throughout the 2022-2025 period. While hogs spiked, crashed, and recovered, loin prices remained relatively flat and range-bound, largely ignoring hog moves.
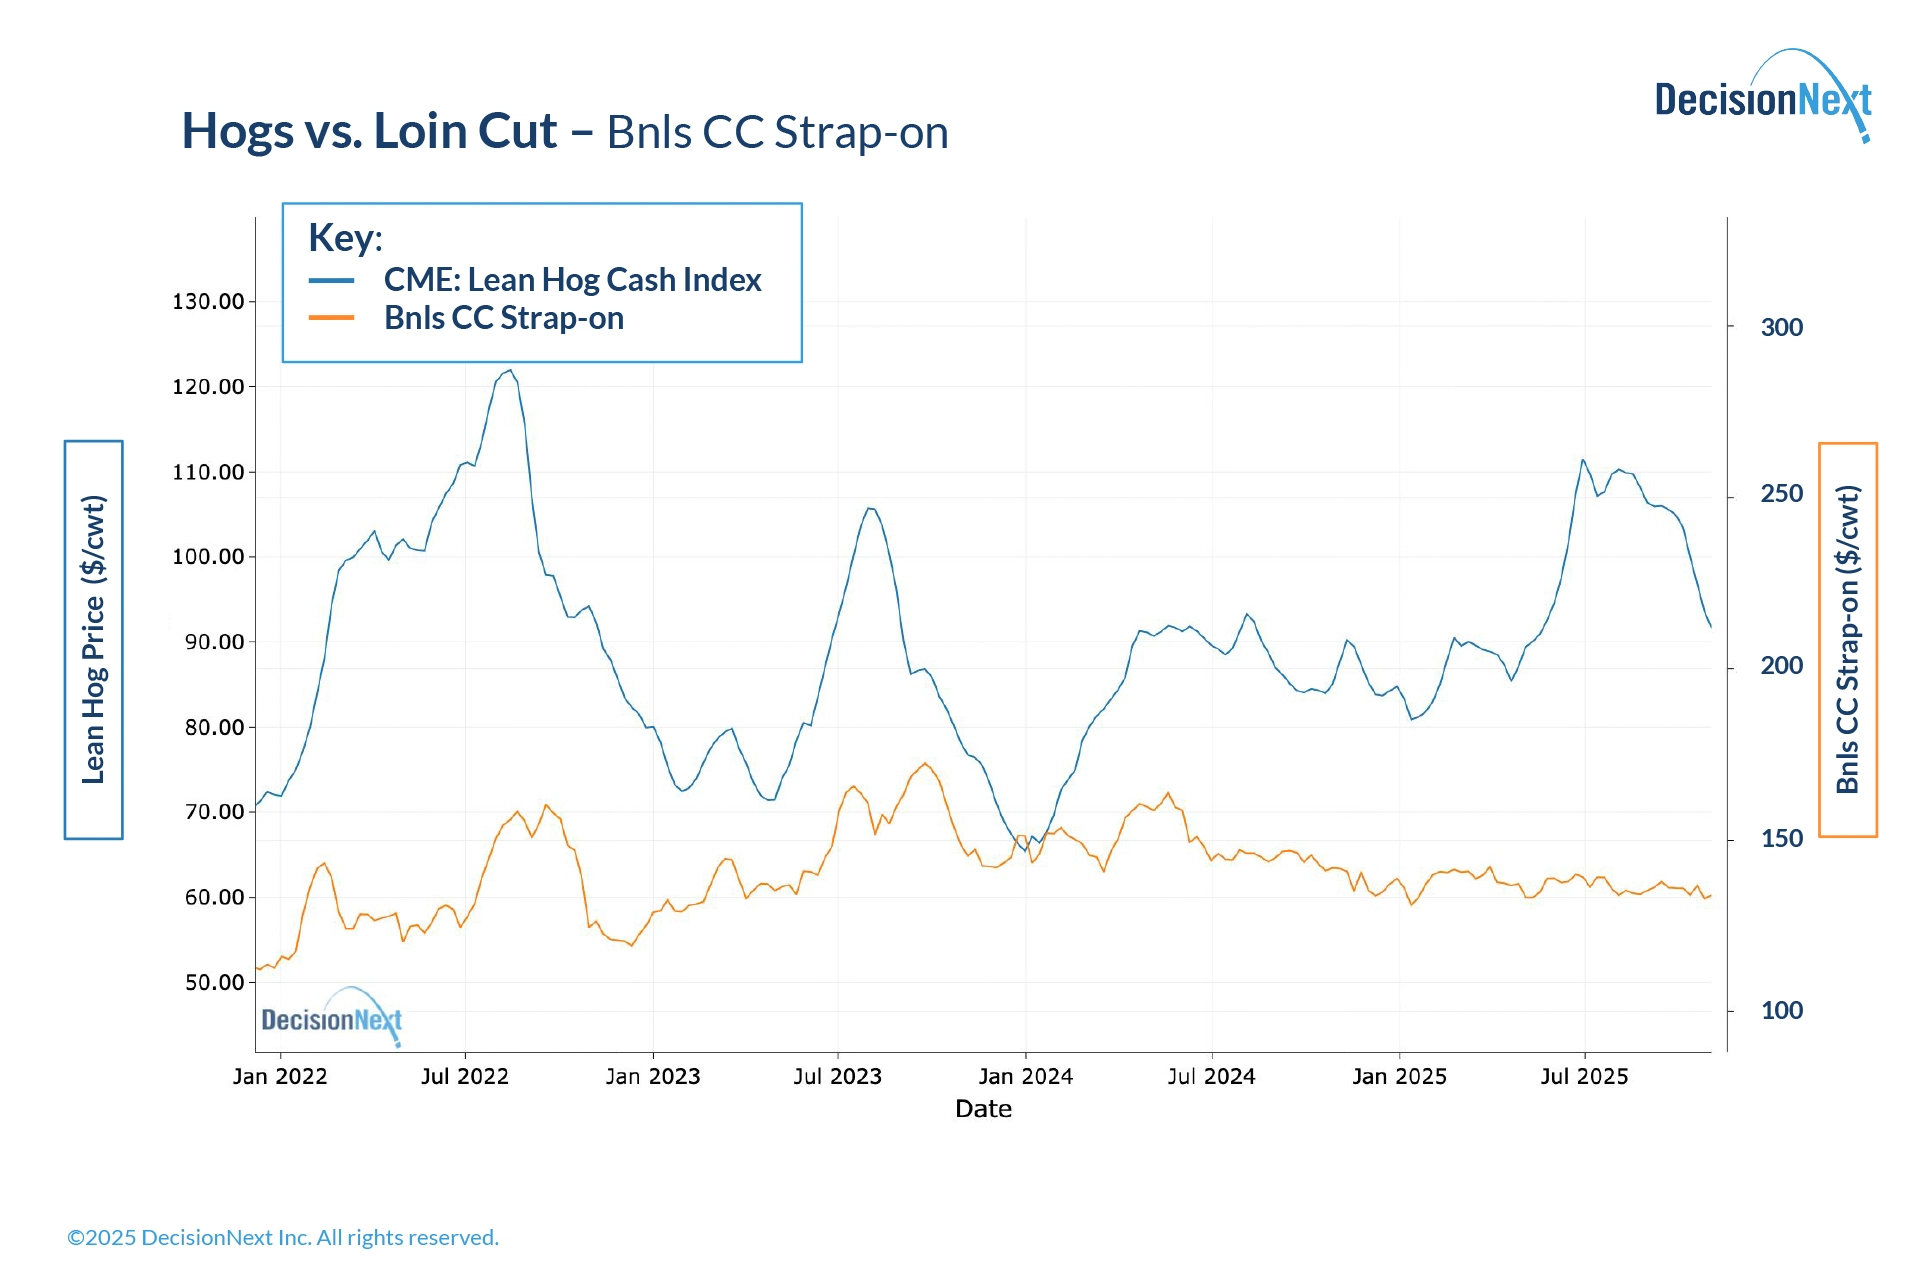 Figure 4 - CME Lean Hog Index vs. Boneless CC Strap-On Loin (2022-2025).
This independence reflects loin’s position as a premium retail cut with distinct demand drivers. Loin competes with chicken breast and other center-of-plate proteins in the retail case. Its pricing is often more sensitive to consumer spending patterns, competing protein prices, and retailer merchandising strategies than to hog supply fundamentals.
Forecasting implication: Hog-based models provide limited value for loin. You need models built on loin-specific data that capture the cut’s actual price drivers.
What This Means for Your Procurement Strategy
The core insight is simple but consequential: one forecasting approach doesn’t work for all pork cuts.
For high-correlation cuts like trim, a hog fundamentals approach is appropriate and effective.
For variable-correlation cuts like ham and spareribs, you need multiple perspectives. A hog-based model provides baseline direction, but you should supplement it with cut-specific models.
For low-correlation cuts like loin, abandon the hog anchor. These cuts require forecasting frameworks built from cut-specific data and demand signals.
The practical takeaway: track correlation over time for each cut you buy. When correlation is high, simpler hog-based models can suffice. When correlation weakens, shift to alternative approaches.
Looking Forward
Pork pricing complexity isn’t going away. The structural shift from negotiated-hog-based to cutout-based hog pricing formulas fundamentally changed how prices are discovered.
Individual cuts now have significantly more pricing independence than they did a decade ago.
That creates opportunity for buyers who adapt their forecasting approach to each cut’s price behavior. The data tells you when to trust hog fundamentals and when to look elsewhere.