Rising Dairy Herd Pressures U.S. Butter Prices

Published: January 14, 2026
One of the major stories in dairy markets across 2025 was the precipitous fall in butter prices. For buyers, this kind of move can quickly reset negotiation leverage and near-term pricing assumptions. Since mid-July, the daily cash butter price has fallen from $2.60/lb to $1.40/lb in December (Fig. 1). These price levels had not been seen since the 2020 demand disruptions, when COVID-era shutdowns caused foodservice volumes to collapse and abruptly reshaped dairy demand.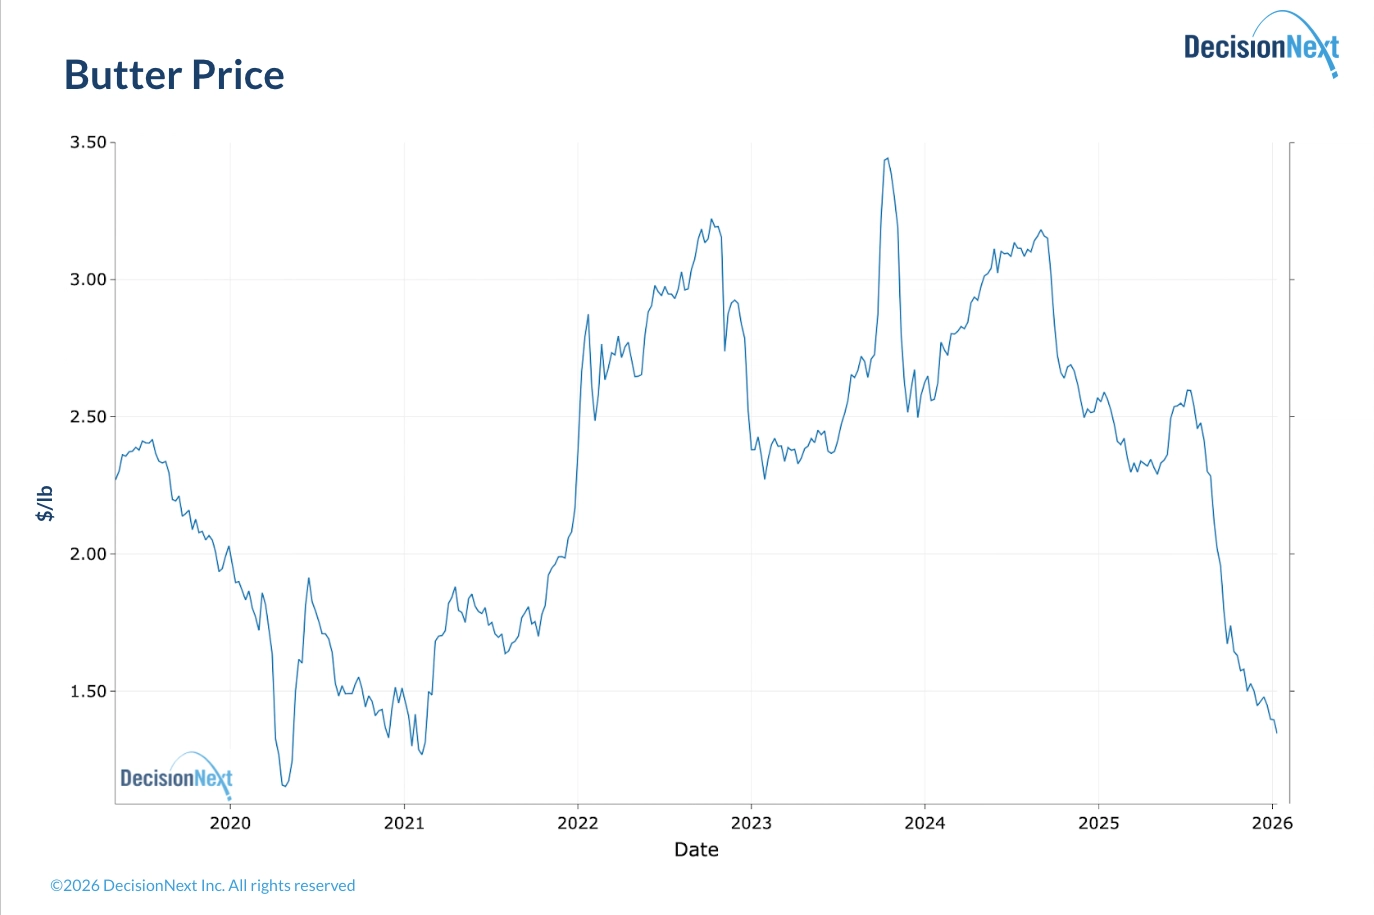
Figure 1 - U.S. Grade AA Butter Prices (CME Cash)
Source: USDA AMS via CME Group
Compared with the demand-driven price shock of 2020, this time the story is largely about supply. Over the course of 2025, the U.S. milking herd rose from roughly 9.25 million to nearly 9.5 million head (Fig. 2). A larger milking herd means more milk, more butterfat, and ultimately more butter production coming to market.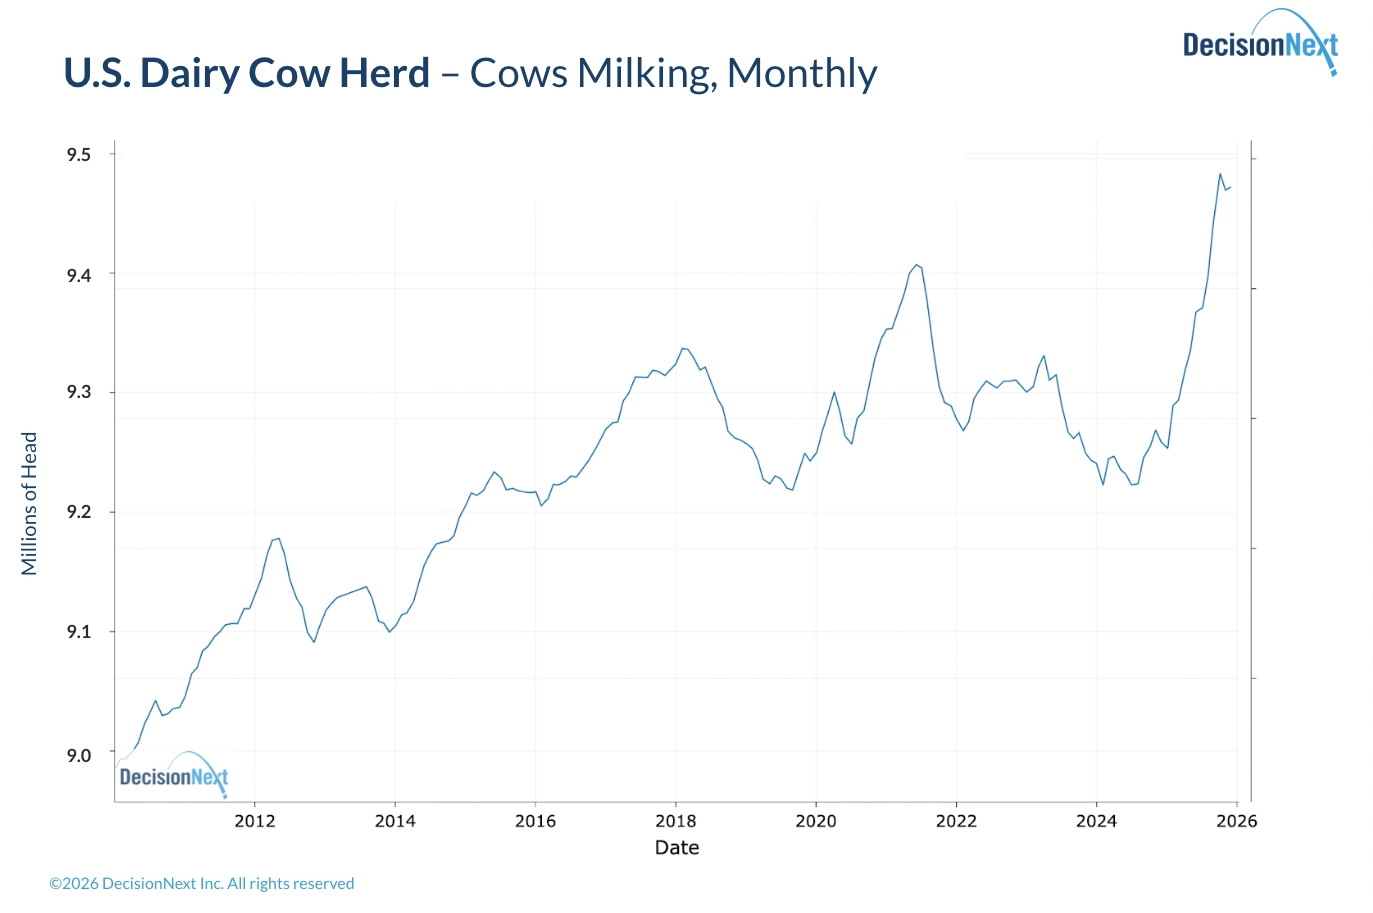
Figure 2. U.S. Dairy Cows in Milk (Monthly)
Source: USDA NASS
The relationship between the number of dairy cows in milk and butter prices is now more strongly correlated than it has been at any point in the past two decades. From 2010 through 2019, cow numbers and butter prices tended to rise together, reflecting a period of strong underlying demand (Fig. 3). Since 2020, the correlation between the two series has diverged with rising cow numbers coinciding with falling butter prices. This trend became even more pronounced in 2025 and is clearly visible in Figure 3.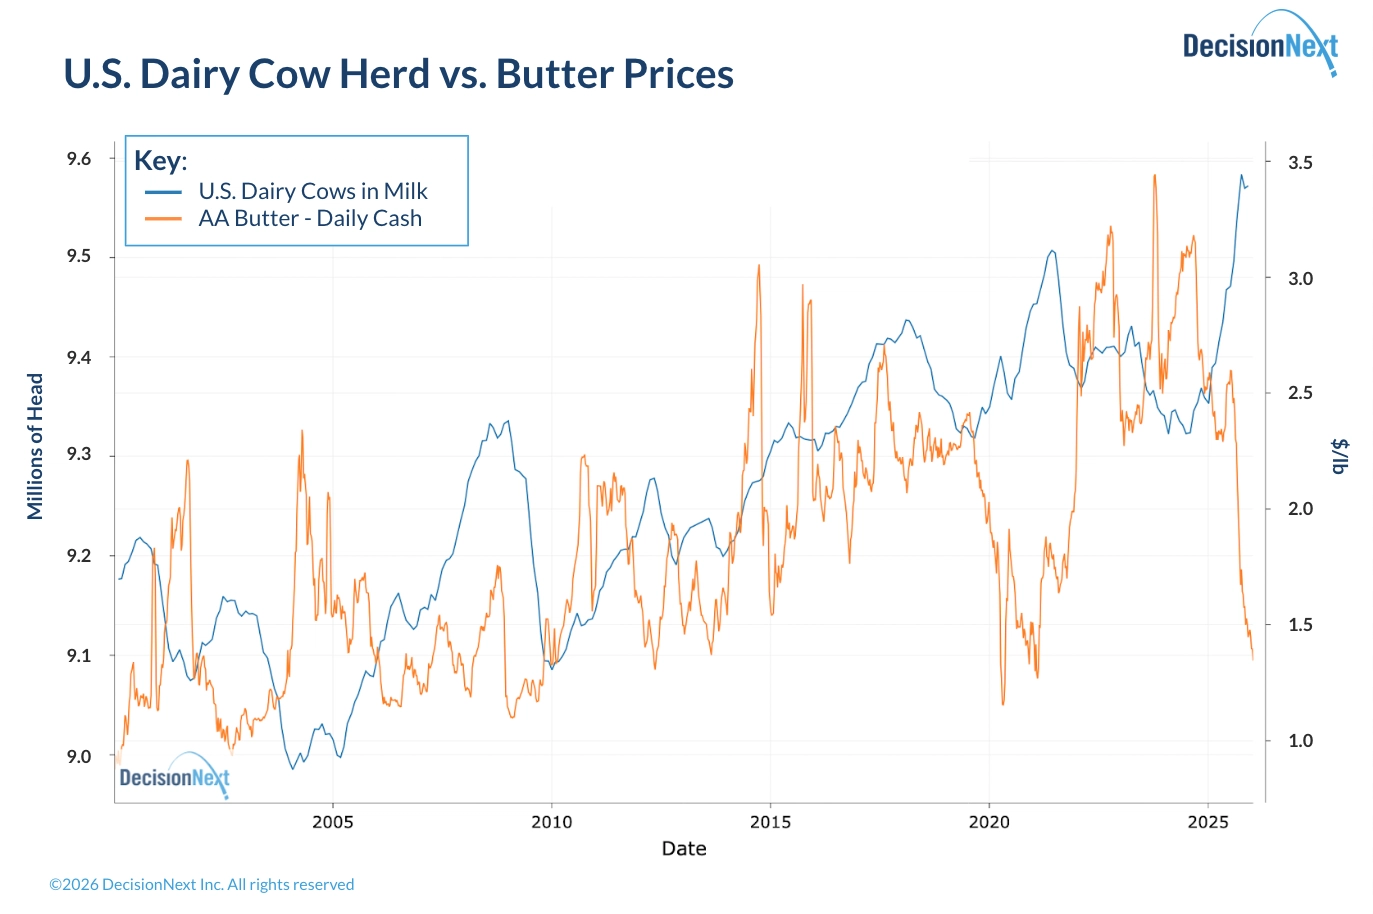
Figure 4. U.S. Dairy Cow Herd vs. Butter Prices
Source: USDA NASS (cows); USDA AMS via CME Group (butter)
Over the past five years, the trend has been clear: where the cow numbers go, so go butter values.
Looking ahead to 2026, the key question is whether sustained low butter prices begin to slow herd growth and curb milk output. Early signals to watch include changes in cow retention, milk per cow, and butter stocks as buyers and processors adjust to thinner margins.
For buyers, staying ahead of that inflection means tracking supply drivers and price signals together — not in isolation — and using forward-looking forecasts to time purchases, manage risk, and negotiate with confidence.