Hamburger prices are up while Hot Dog and White Bread prices are down year-over-year.
Note our latest addition to the DecisionNext monthly index report: Supermarket Rotisserie Chicken Index. The introduction of this in-demand finished good rounds out our capabilities in the three major protein categories.
Finished Goods Forecast Indices – September 2022 – September 2023

Figure 1 – DecisionNext finished goods indices for September 2023. To see last month’s index, click here.
Why include Rotisserie Chicken in the index?
DecisionNext is always striving to find better ways to serve our customers. Including this important set of poultry data series, we have enhanced our capabilities for organizations that deal with all three major protein groups.
When it comes down to it, Americans eat a lot of meat. While red meat still tops the charts in terms of sales value, the sales volume of poultry is larger than those of beef and pork combined. In 2022, the US produced 115 lbs of poultry per capita compared to the 111.6 pounds per capita of red meat.1
Production and Sales of the US chicken industry was $46.1 billion in 2021, up 31 percent from $35.1 billion in 2020, (31% year-over-year increase).2
Poultry is nuanced.
Historically, the typical approach to poultry pricing has been straightforward: the cost of chicken feed would drive the cost of chicken. But things have changed. While feed prices still play a critical role, low exports, cold storage, eggs laid, regional variations, labor and other variables can all have a significant impact on poultry prices. And this increase in market complexity has resulted in the breakdown of previously reliable forecasting models.
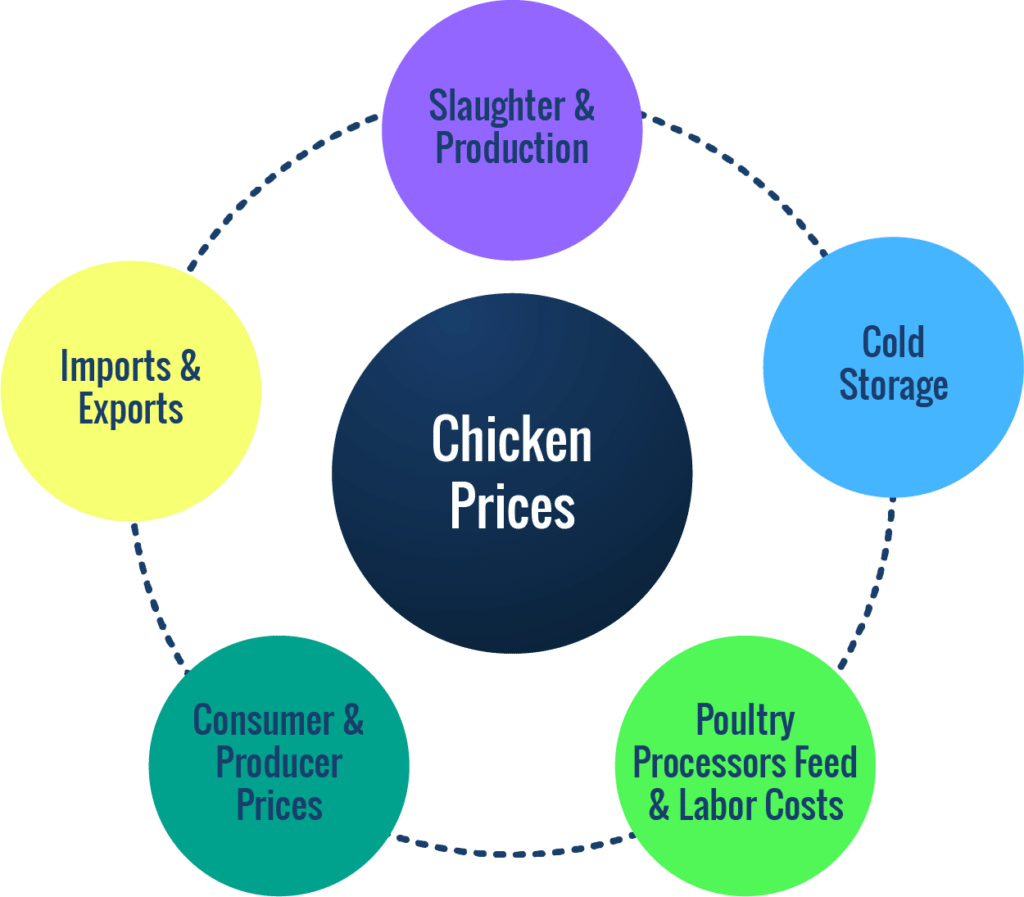
Figure 2 – For accurate poultry forecast models, it is important to consider a large group of driver variables.
Question is, why is this happening? To get a better understanding of what the future holds, let’s take a quick look at past and current wheat prices.
NEW: Rotisserie Chicken Index Deep Dive
Rotisserie Chickens posted an index number of 79, projected to be down $0.31 year over year in September.
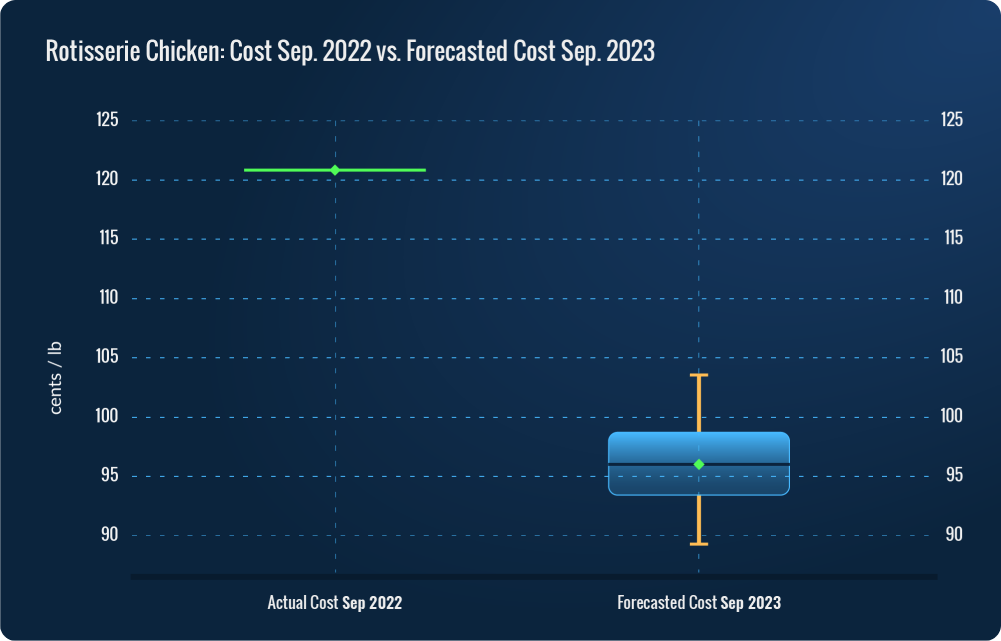
Figure 3 – Rotisserie chickens forecasted at $0.96 in September 2023, down $0.31 cents year over year.
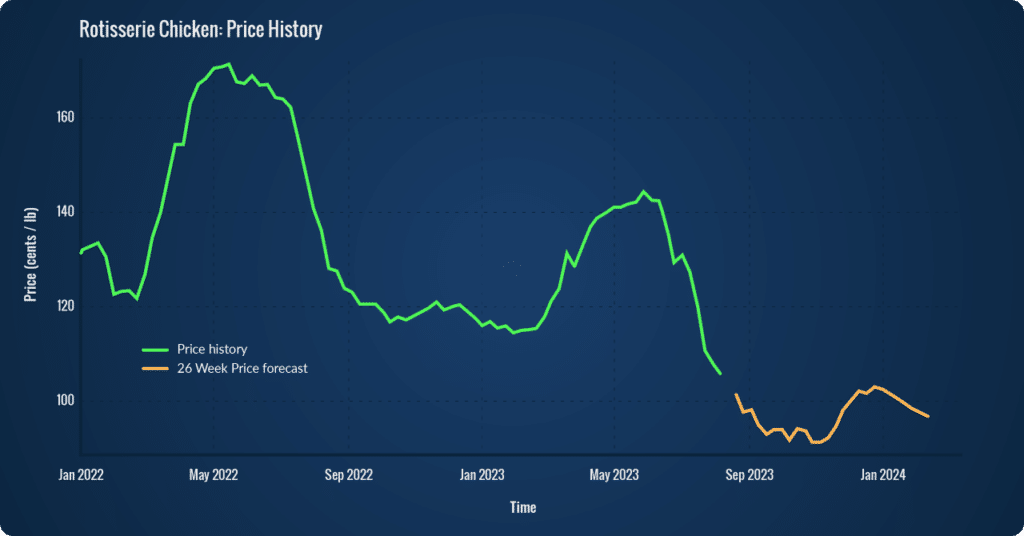
Figure 4 – Rotisserie chicken price history and 26 week forecast.
Why are Rotisserie Chicken Prices Dropping?
Lower commodity feed prices from improving US production and higher cold storage inventories are expected to put downward pressure on prices. We expect to see that downward pressure on prices continue over the next couple months before climbing back up above $1.00 as we enter the new year.
Key Takeaways
Overall, the DecisionNext Finished Goods Index Report showcases the flexibility of our tool’s range of solutions. It offers multi-commodity forecasting for all three major protein groups consolidated into a single finished goods forecast. It also shows the ability to choose the timeframe for the forecast and the option to customize recipe templates to optimize finished goods profitability.
*How the Indices are Calculated:
The index number for each finished good is calculated by taking the forecasted aggregate price for the inputs in for the upcoming month and dividing it by the historical aggregate price for those same inputs over the same time period last year. Essentially, we are using the tool to forecast the finished goods cost in a future month and then making the YoY comparison to the actual cost from the previous year.
Sign up for our FREE newsletter The Formula.
Every month you’ll get a Finished Good Report along with a deep dive, so you can start to track important trends over time.
1 https://www.carlisletechnology.com/blog/us-poultry-industry-stats-2022

