Finished Goods Forecast Indices: June 2024 (Fig. 1)
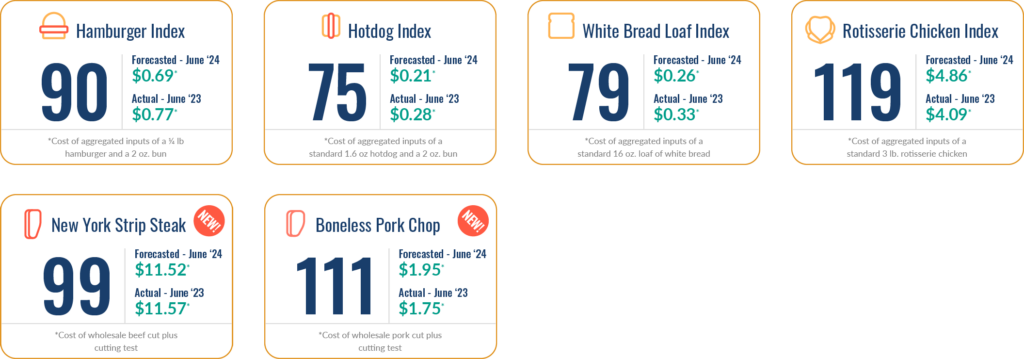
Figure 1 – DecisionNext finished goods indices for June 2024 (forecast locked on 4/28/24). To see last month’s index, click here.
May 2024 Index Report
In the March issue, we talked about how Chicken continues to creep up on relatively high prices of competing proteins. Turns out, the run up to summer is playing out pretty much as we expected.
Also, enjoy the NEW addition of a couple of key grilling items in this month’s Finished Goods Forecast Index dashboard.
May Deep Dive
As things heat up and you wonder what to grill this summer, we thought it was a good idea to expand our indices. This month, you’ll notice we’ve added a couple of backyard staples to the dashboard: Boneless Strip Steaks and Boneless Pork Chops. There’s a lot of action in the meat case this time of year, and uncertainty is showing up in the forecast models in spades.
Boneless NY Strip Steaks:
We use the USDA Choice 0x1 Boneless Strip Loin as a primal and run it through our cutting test yield calculator. Then we do a million simulations to forecast its price for the next five months compared to last year. And it’s all calculated in minutes from the desktop DecisionNext Transaction application.

Figure 2 – NY Strip Steak 5 month finished goods chart
Boneless Pork Chops:
In the same manner, we use the Strap-off Boneless Center-Cut Pork loin as the primal, yield it out, and then run the same simulation in the software. We can then see its own probabilistic price range for the next five months.
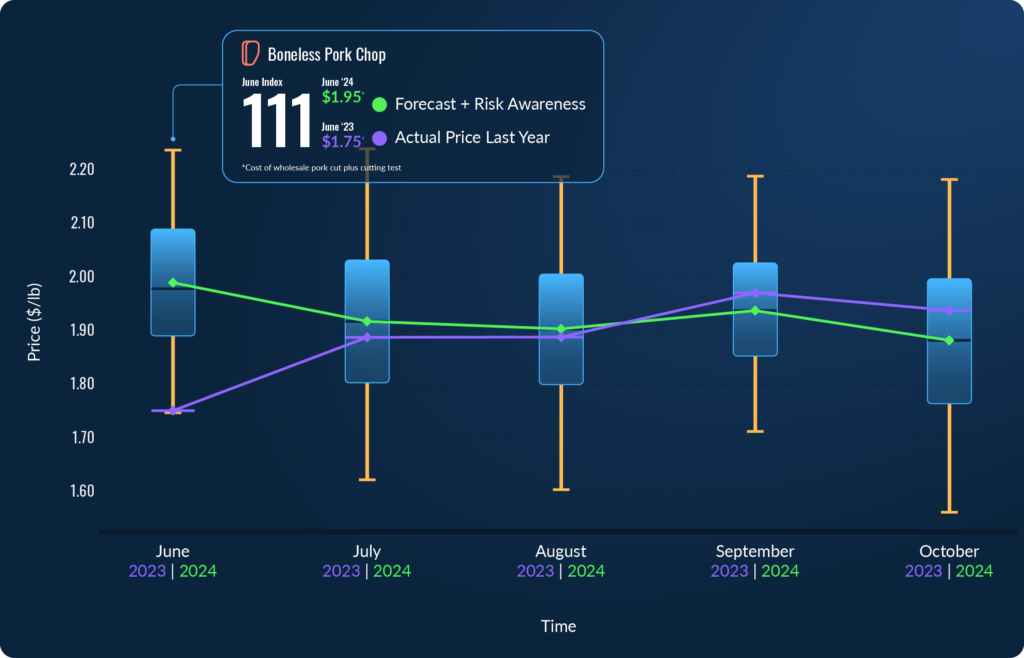
Figure 3 – Boneless Pork Chop 5 month finished goods chart
For easy reference, here’s a quick reminder on how to read a box-and-whisker chart (Fig. 2 & Fig. 3). You’ll see that half of the predicted prices for June–October 2024 are in the boxes, while 90% of the outcomes fall within the orange whiskers. The neon green trend line connects the median forecast value for each month.
The wide range of probable prices for these two cuts of grilling meats indicate high market volatility. This is expected to continue through the summer months. For example: Boneless Pork Chops for June are forecast to drop anywhere within $1.75/lb to $2.25/lb in 90% of our simulations.
Whatever happens, one thing is for certain. Whatever center plate protein cut you choose to grill, it’s likely to be as expensive as last summer.
Contact us if you want to see the six-month input cost forecast comparison for any of the other finished goods included in this report.
About the Report
Overall, the DecisionNext Finished Goods Index Report showcases the flexibility of our tool’s range of solutions. It offers multi-commodity forecasting for all major proteins and grains consolidated into a single finished goods forecast for illustration. The report also shows the ability to choose the timeframe for the forecast and the option to customize recipe templates to optimize finished goods profitability.
*How the Indices are Calculated:
The index for each finished good is calculated by taking the forecasted aggregate price for the inputs for the month in question and dividing it by the historical aggregate price for those same inputs over the same time period last year. Essentially, we are using the tool to forecast the finished goods cost for the month, and then making the YoY comparison to the actual cost from the previous year for that same time period.
Sign up for our FREE newsletter, The Formula.
Every month you’ll get a Finished Good Report along with a deep dive, so you can start to track important trends over time.

