The DecisionNext Finished Goods Index Report | August 2026
Published: August 13, 2026
Three Proteins, Three Cost Trajectories
The August DecisionNext Finished Goods Index shows the protein complex continuing to move in different directions.
Cheeseburger costs remain elevated but relatively stable, with little change forecast through October. Hot dog costs have retreated considerably from their spring peak but are now forecast tofirm counter-seasonally into winter. Meanwhile, chicken sandwich costs are projected to continue falling as declining chicken breast prices create further separation from beef and pork.
For procurement teams, retailers, and foodservice operators, these distinct trajectories create different considerations for purchasing, pricing, promotions, and margin management.
Key Insights
- Cheeseburger costs remain elevated but stable, with the index forecast between 112 and 114 through October.
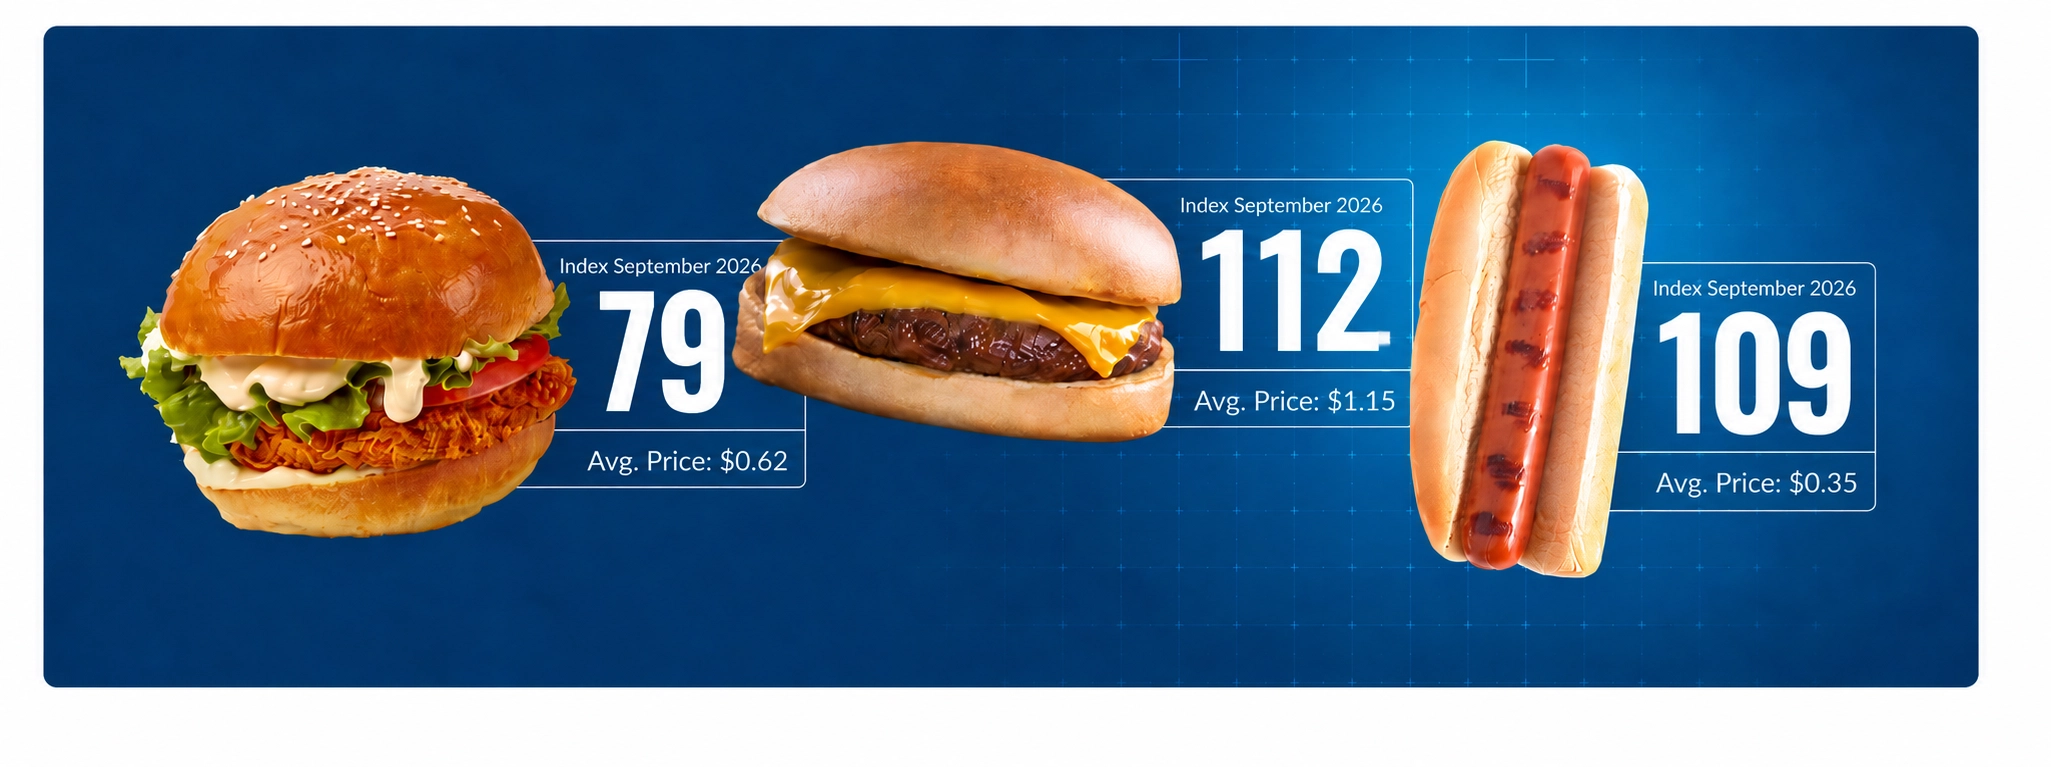
- Hot dog costs have fallen from their May peak, but are now forecast to rise counterseasonally from 108 in August to 110 in September and continue edging higher into winter.
- Chicken sandwich costs are projected to fall sharply, with the index declining from 77 in August to 66 by October.
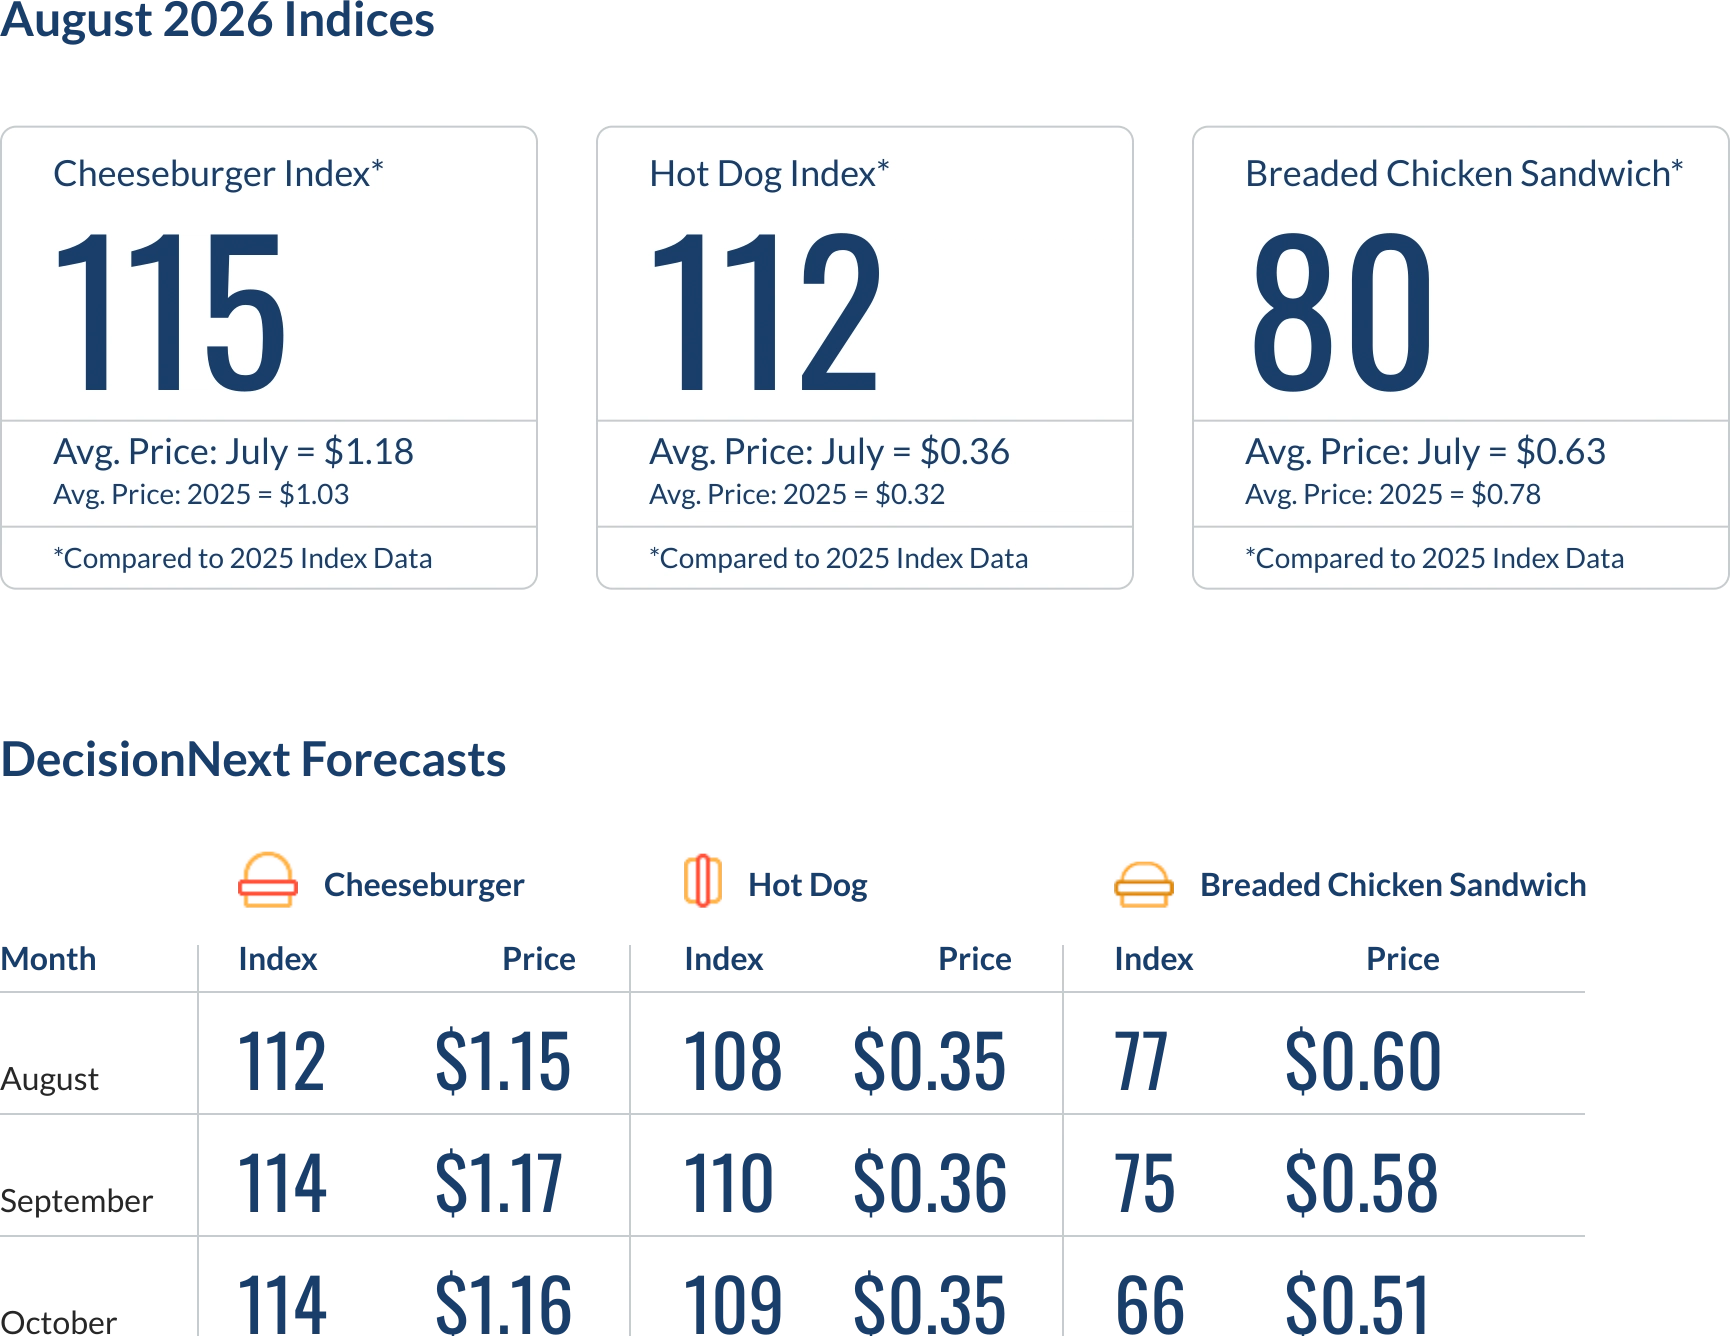
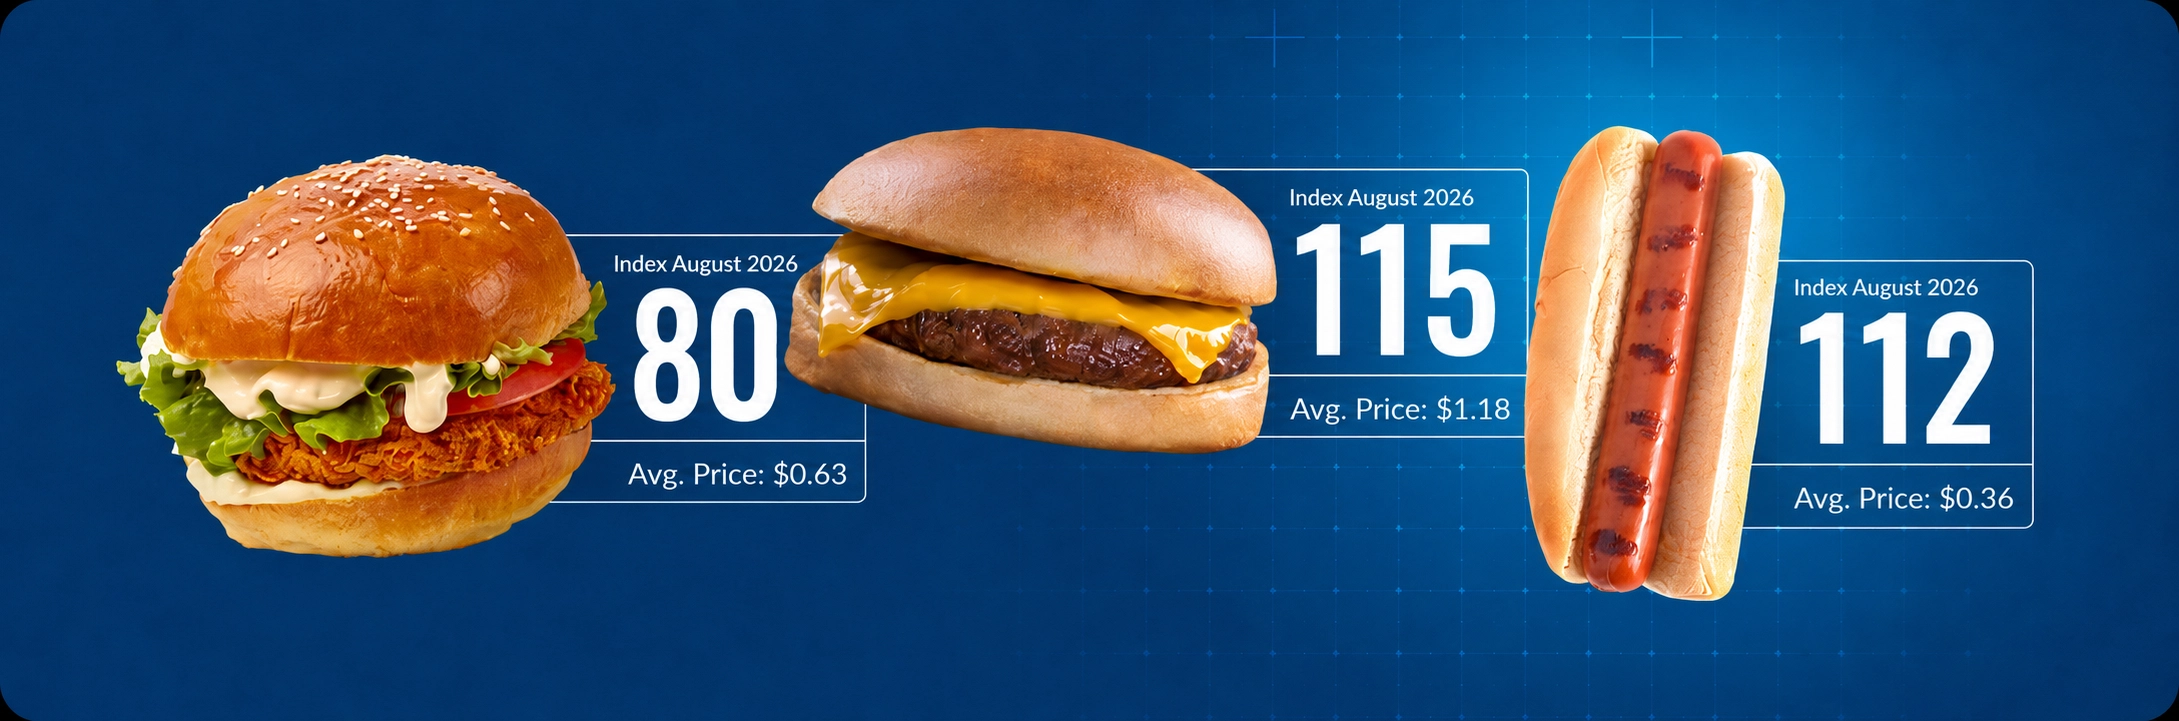
Figure 1 – July 2026 index values and DecisionNext forecasts for August through October.
Cheeseburger Index
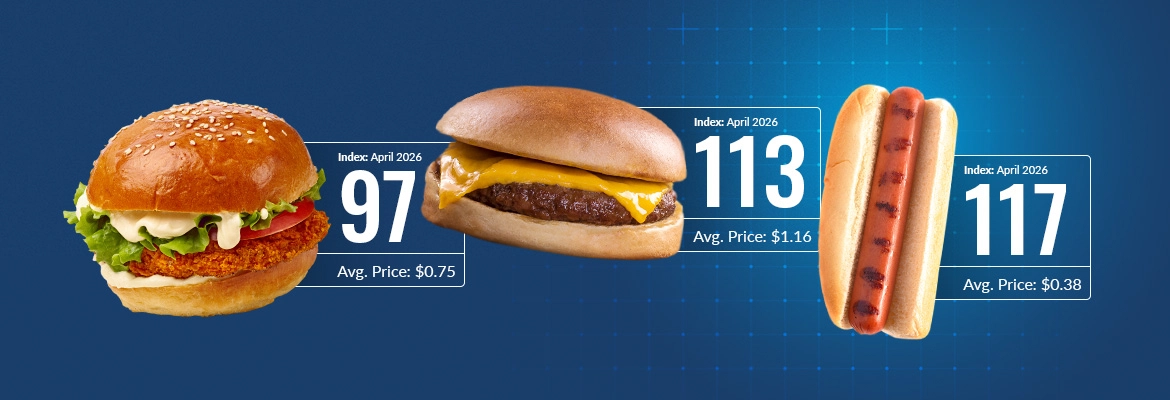
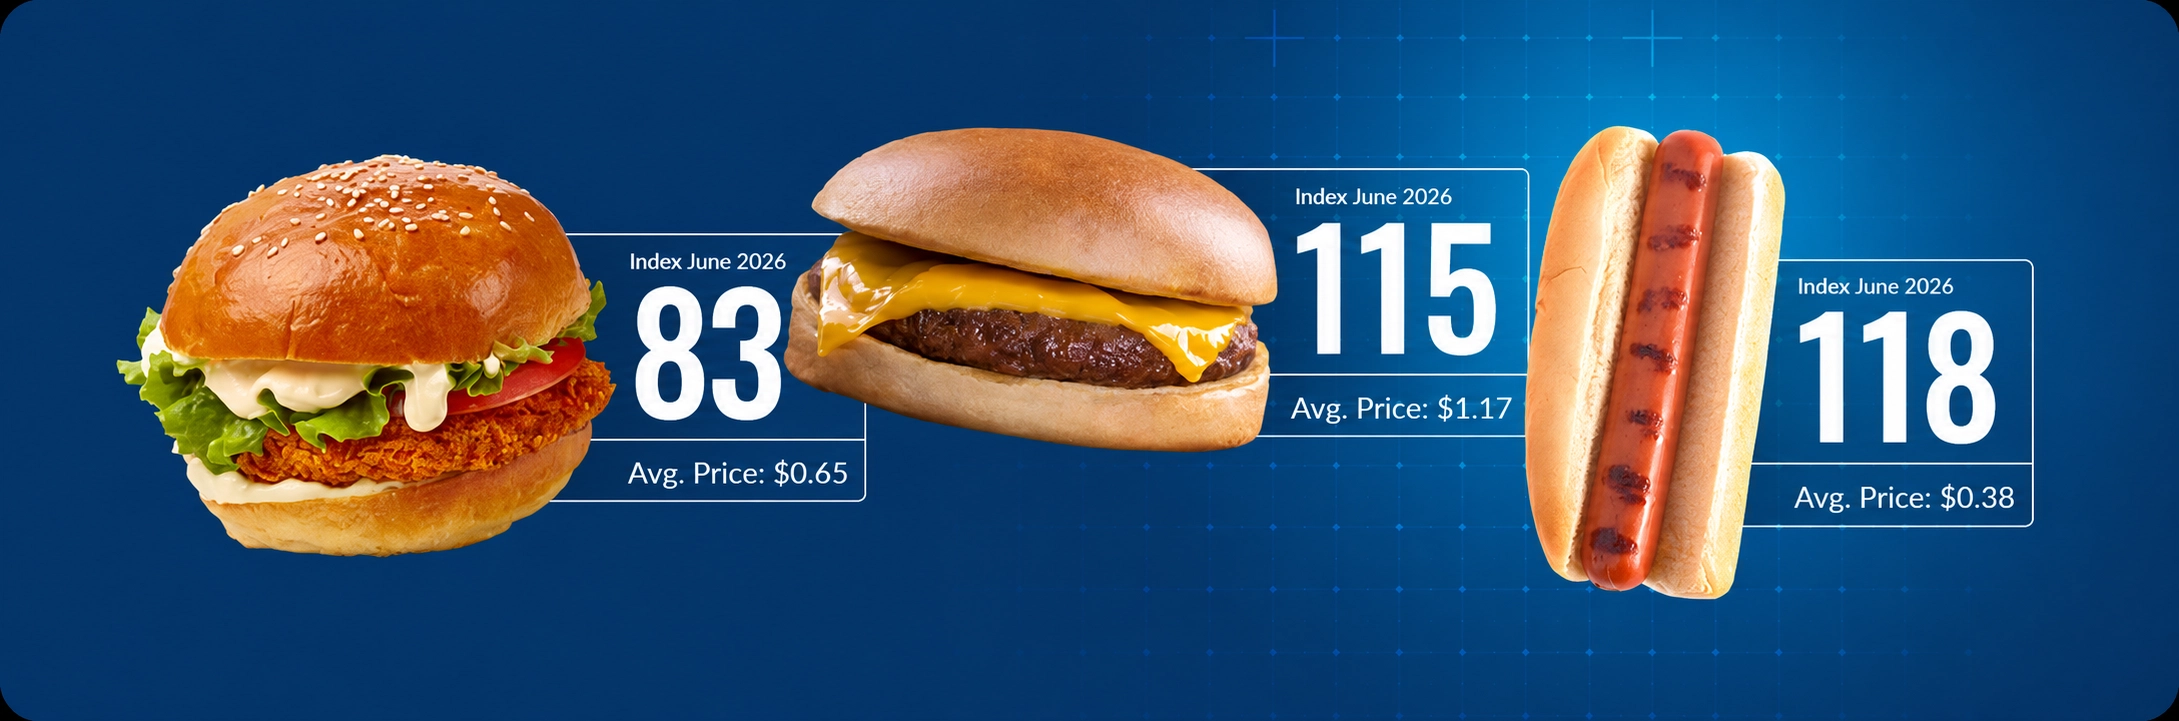
The Cheeseburger Index averaged 115 in July, representing a raw-material cost of approximately $1.18 per serving. That was slightly above July 2025 and only marginally below the May 2026 peak.
The index is forecast to ease to 112 in August before stabilizing near 114 in September and October. Raw-material costs are projected to remain between approximately $1.15 and $1.17 per serving throughout the period.
DecisionNext forecasts the individual components behind the finished-good index and then aggregates them to show how changing input prices may affect the total cost. Lean-beef inputs remain central to the outlook as fresh 90% lean and fresh 50% lean beef are both forecast to remain relatively stable through end of year.
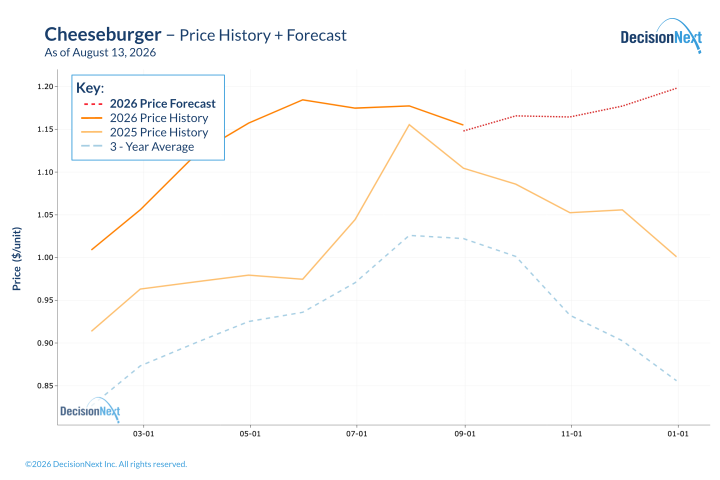
Figure 2 – Cheeseburger raw-material costs remain elevated, with limited movement forecast through October.
Hot Dog Index
The Hot Dog Index averaged 112 in July, representing a raw-material cost of approximately $0.36 per serving. That was down from its May peak of 122 and well below the July 2025 index of 125.
The index is forecast to decline further to 108 in August before rising modestly to 110 in September and settling near 109 in October. Raw-material costs are expected to remain between approximately $0.35 and $0.36 per serving.
Importantly, while this appears to be a stabilization story, the underlying pork input trajectory suggests a subtle counter-seasonal firming bias into winter rather than continued seasonal weakness.
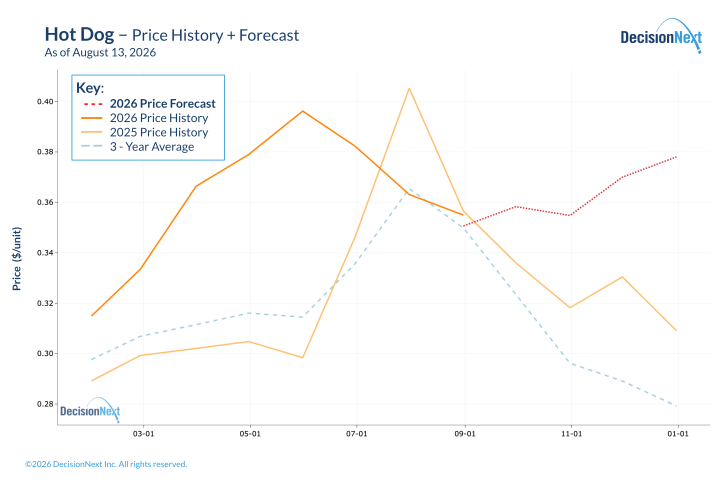
Figure 3 – Hot dog costs have retreated from their spring peak, with modest firming forecast for September.
Chicken Sandwich Index
The Breaded Chicken Sandwich Index averaged 80 in July, representing a raw-material cost of approximately $0.63 per sandwich. That was well below both July 2025 and the 2025 average.
Further declines are forecast through the fall. The index is projected to fall from 77 in August to 75 in September and 66 in October, bringing the estimated raw-material cost down from approximately $0.60 to $0.51 per sandwich.
Declining chicken breast prices remain the primary driver, while the other major inputs are comparatively stable.
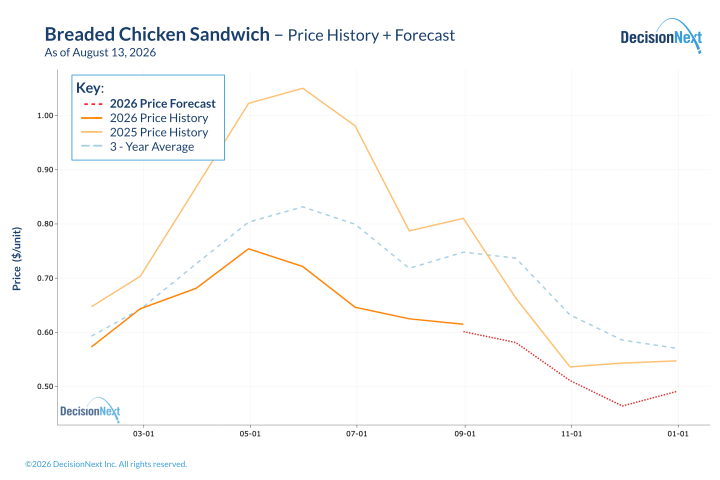
Figure 4 – Falling chicken breast prices are projected to push chicken sandwich costs lower through end-of-year.
The Protein Cost Gap Continues to Widen
The August outlook reinforces that protein costs are no longer following a shared trajectory.
Cheeseburger costs remain elevated with limited relief in sight. Hot dog costs are now forecast to firm counter-seasonally into winter. Chicken sandwich costs, by contrast, are forecast to continue falling sharply.
By October, the Cheeseburger Index is forecast near 114 and the Hot Dog Index near 109, while the Chicken Sandwich Index is projected to fall to 66. That widening gap could create greater flexibility for chicken promotions and margin recovery, while elevated beef costs continue to constrain burger economics.
For buyers and sellers, understanding the components driving each index provides a clearer view of where costs may settle—and where purchasing, pricing, or risk-management strategies may need to differ across proteins.
Want to see the data behind these forecasts or run your own analysis? Connect with DecisionNext or access the platform today.
About the Report
The DecisionNext Finished Goods Index showcases multi-commodity finished-goods cost forecasting across protein, dairy, grain, and ingredient markets. See the full Finished Goods Index methodology.
By comparing current values with average prices from 2025, the index helps stakeholders visualize current and forward cost pressures and profit opportunities across value-added food products. The DecisionNext platform enables users to forecast finished-good costs, adjust recipes, and analyze forward-looking scenarios.