The DecisionNext Finished Goods Index Report | September 2026
Published: September 17, 2026
Post-Summer Costs Reset—But the Fourth-Quarter Outlook Is Splitting
The September DecisionNext Finished Goods Index shows a broad post-summer reset across the protein complex.
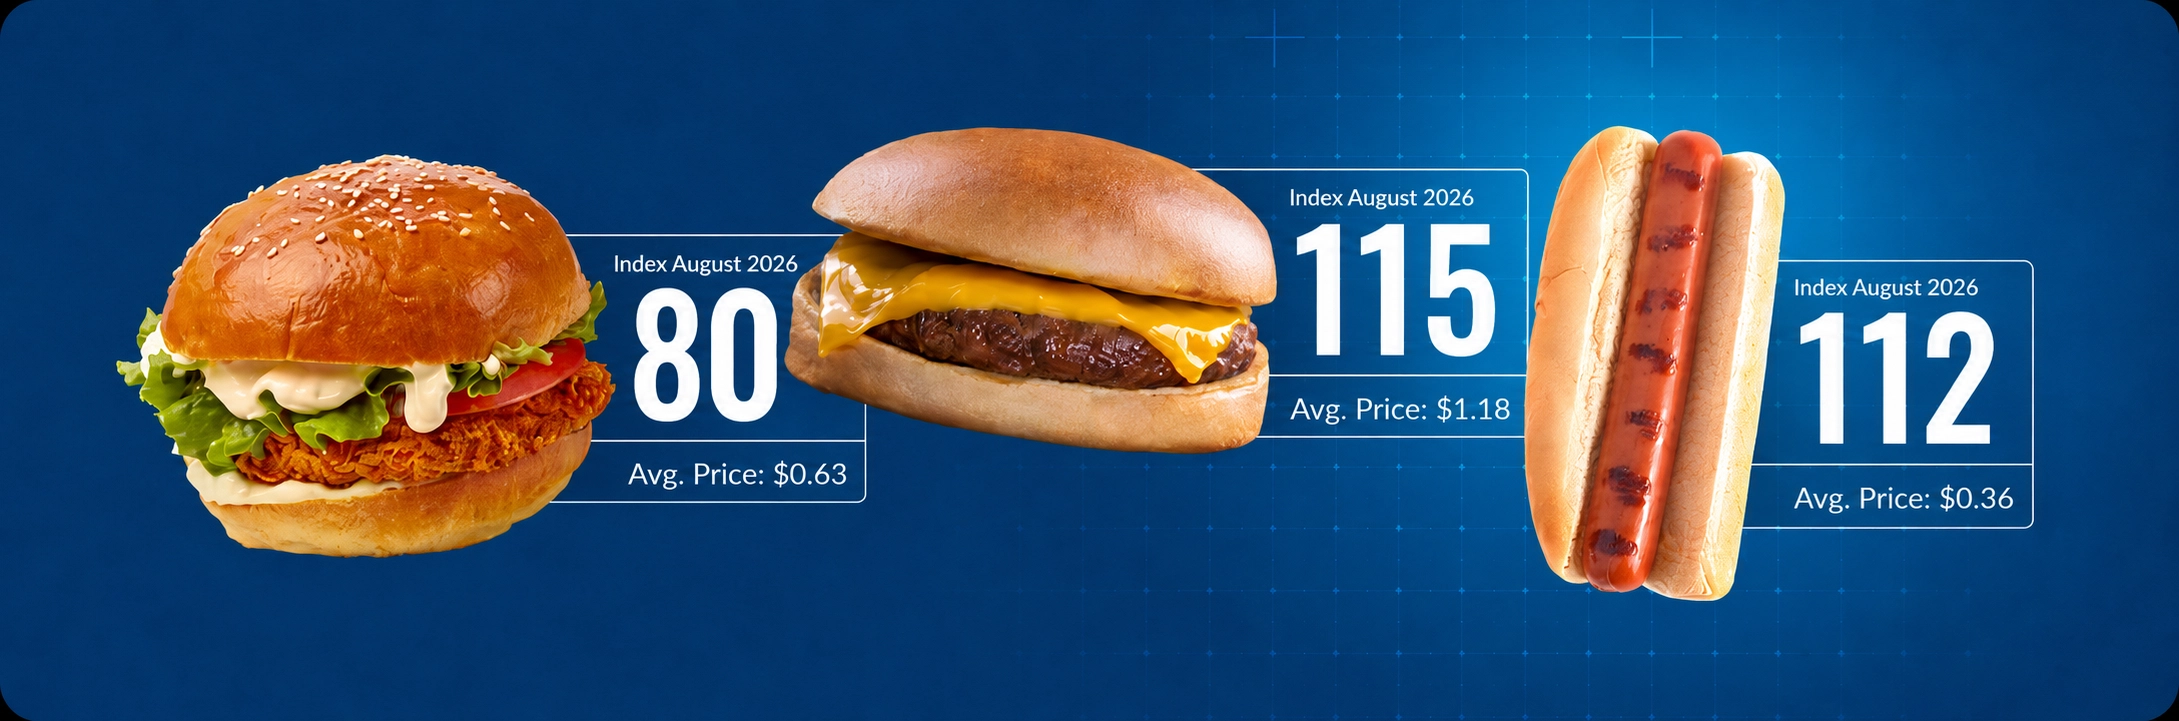
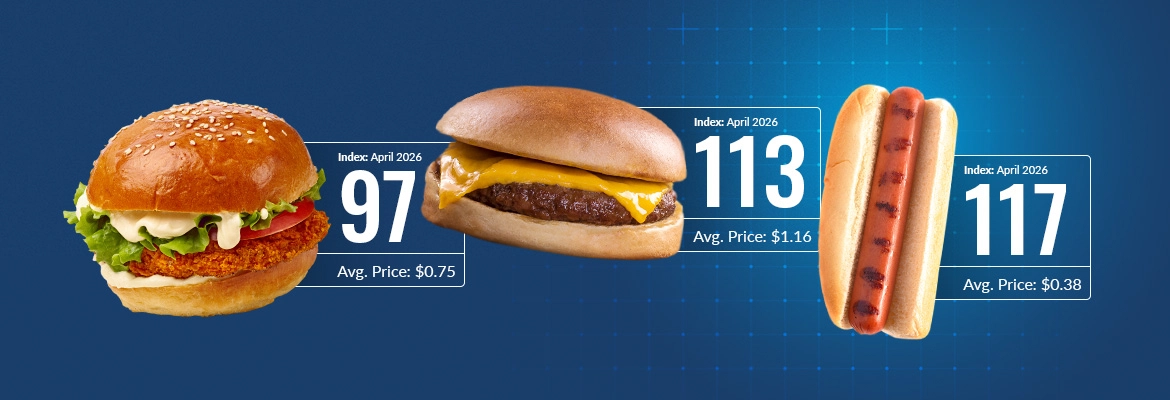
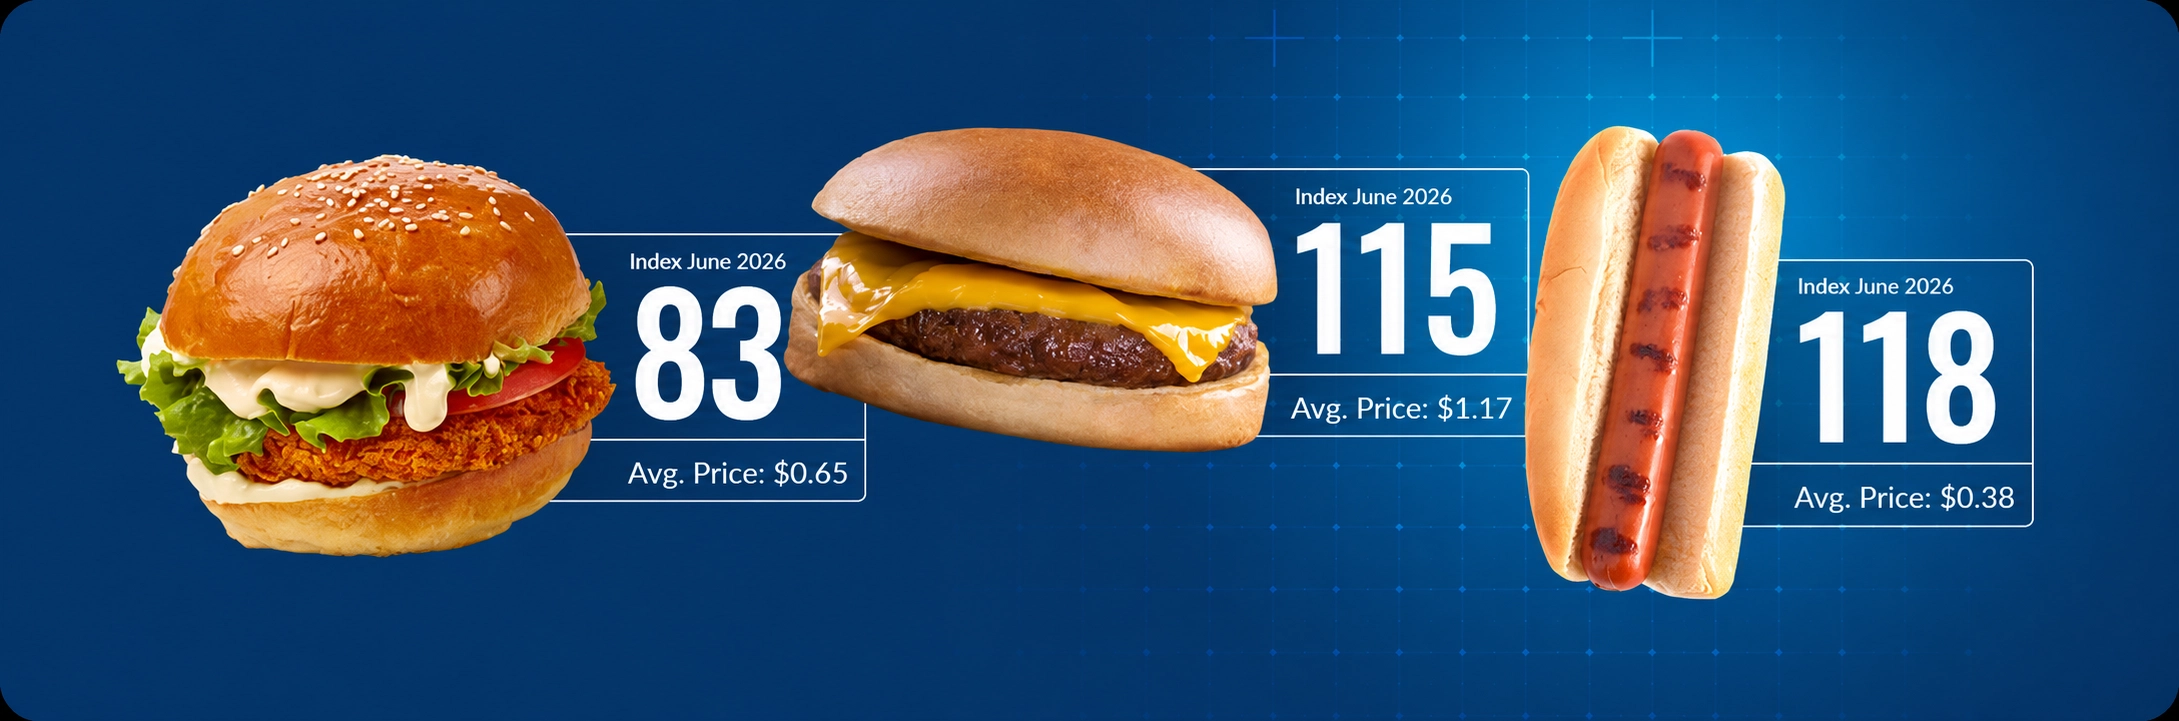
Cheeseburger and hot dog costs have both retreated from their summer levels. From here, cheeseburger costs are forecast to hold relatively steady through year-end, while hot dog costs begin to firm again. In contrast, breaded chicken sandwich costs are following a different trajectory, with further declines expected as lower chicken breast prices continue to flow through the finished-good basket.
For procurement teams, retailers, and foodservice operators, that divergence creates different considerations by category. Beef-heavy burger costs offer limited near-term relief, hot dogs show renewed cost pressure into the fourth quarter, and chicken may create greater room for promotions or margin recovery.
Key Insights
- The Cheeseburger Index is forecast near 104 in September and is expected to remain between 104 and 105 through December.
- The Hot Dog Index is forecast near 103 in September, before rising to 107 in November and easing slightly in December.
- The Breaded Chicken Sandwich Index is forecast near 79 in September and is projected to fall to approximately 68 in November, before a modest year-end rebound.
- The fourth-quarter outlook is increasingly ingredient-specific: beef 50s create upward pressure in both beef-linked baskets, while declining chicken breast costs continue to pull the Chicken Sandwich Index lower.
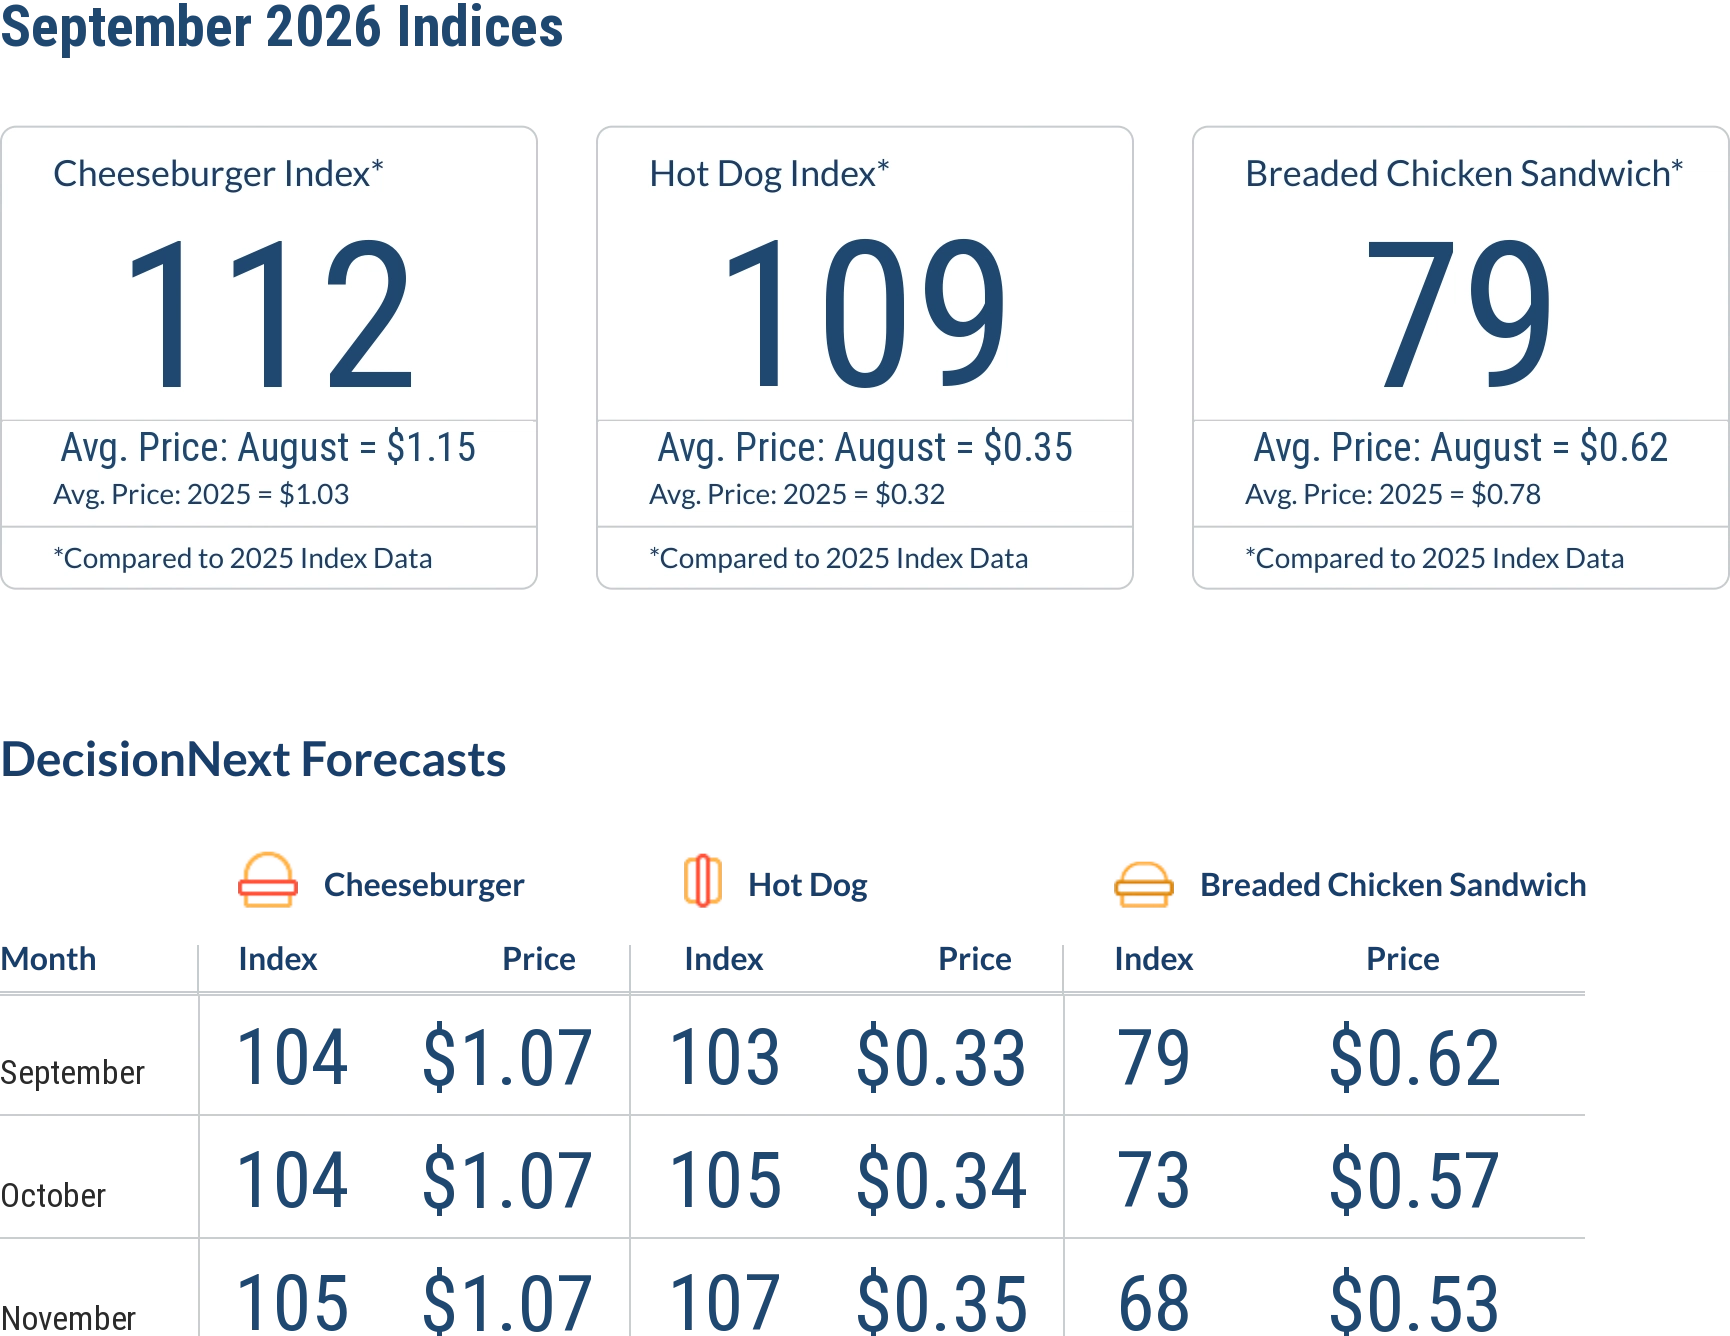
Figure 1 – August 2026 index values and DecisionNext forecasts for September through November.
Cheeseburger Index
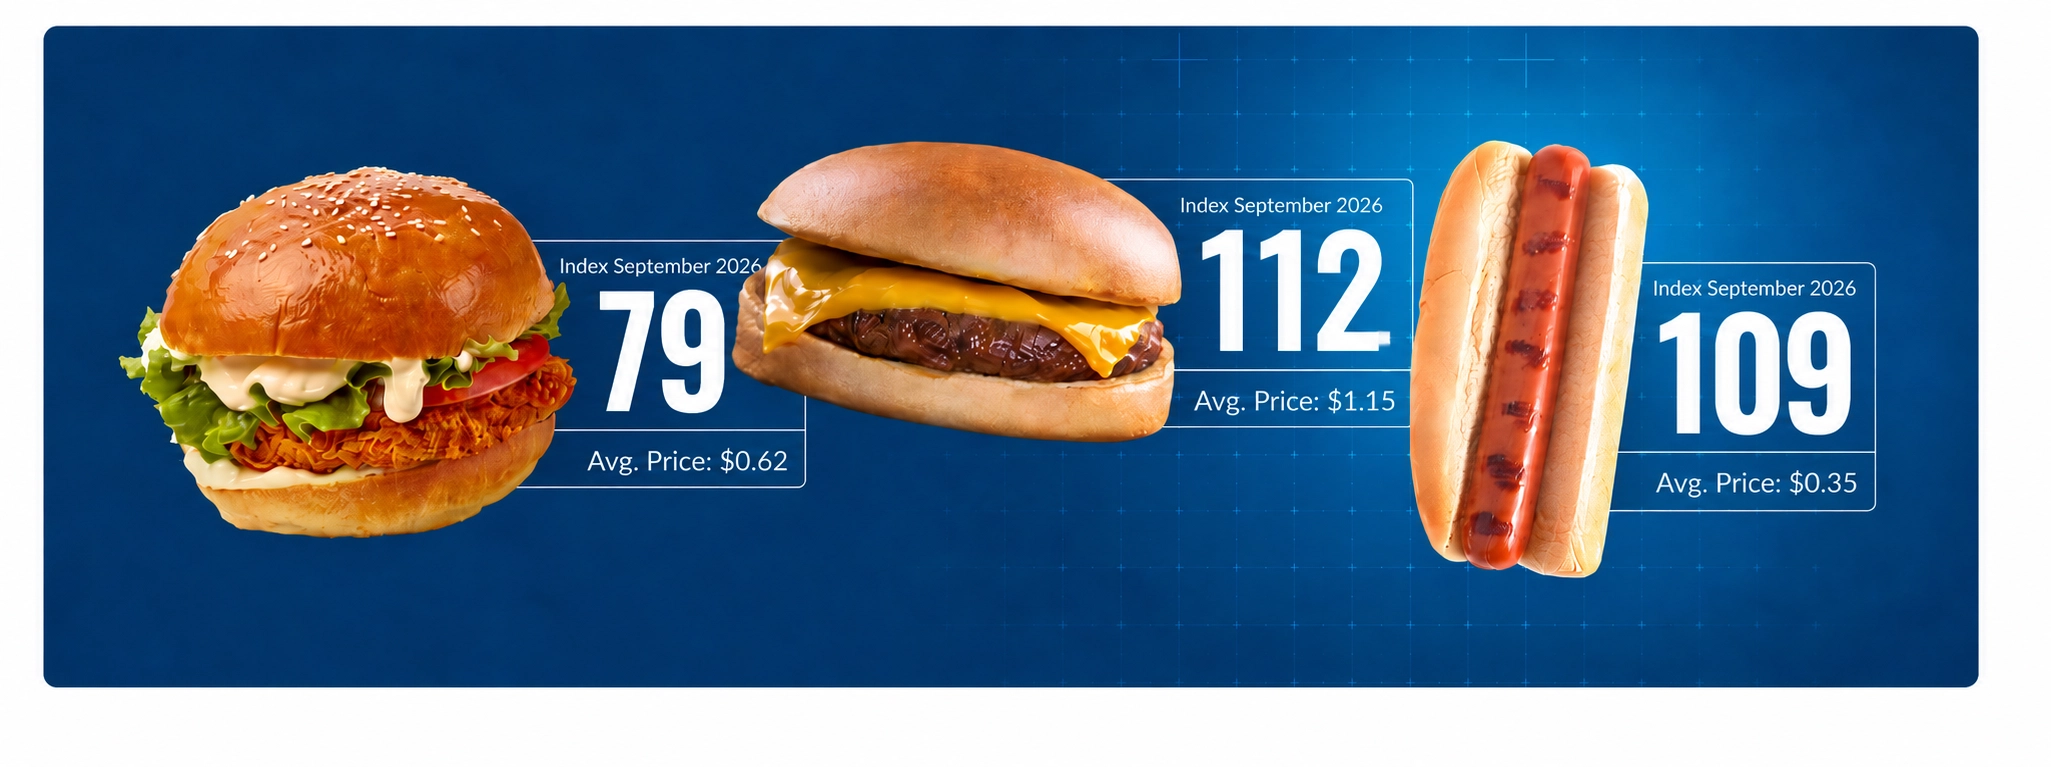
The Cheeseburger Index is forecast near 104 in September, representing a raw-material cost of approximately $1.07 per serving. That is down from an August index value of approximately 112 and slightly below September 2025.
The outlook suggests that most of the post-summer decline has already occurred. The index is forecast to remain near 104 through December, with estimated raw-material costs holding between around $1.07 per serving.
The relative stability of the finished good masks movement within the recipe. Fresh 50% lean beef trim is forecast to rise into year-end, while fresh 90% lean trim, cheese, oil, and bun inputs provide partial offsets. The result is a burger basket that remains above the 2025 average but shows little net movement over the balance of 2026.
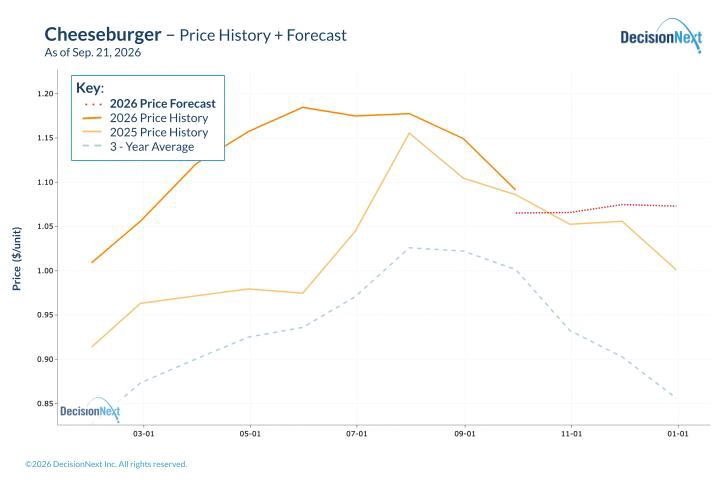
Figure 2 – Cheeseburger raw-material costs are forecast to stabilize following their summer decline.
Hot Dog Index
The Hot Dog Index is forecast near 103 in September, representing a raw-material cost of approximately $0.33 per serving. That is down from an August index value near 109 and roughly in line with September 2025.
Unlike the Cheeseburger Index, however, the hot dog outlook points to renewed fourth-quarter pressure. The index is forecast to rise to approximately 105 in October and 107 in November, before easing to about 105 in December. Raw-material costs are projected to reach $0.35 per serving at the November high.
Beef and sausage inputs are the primary sources of upward pressure. Those increases are partly offset by softer pork, wheat, and oil costs, but not enough to prevent the overall basket from firming. The pattern reinforces the counter-seasonal bias identified in the August report: rather than continuing to weaken after summer, hot dog costs are expected to recover modestly into winter.
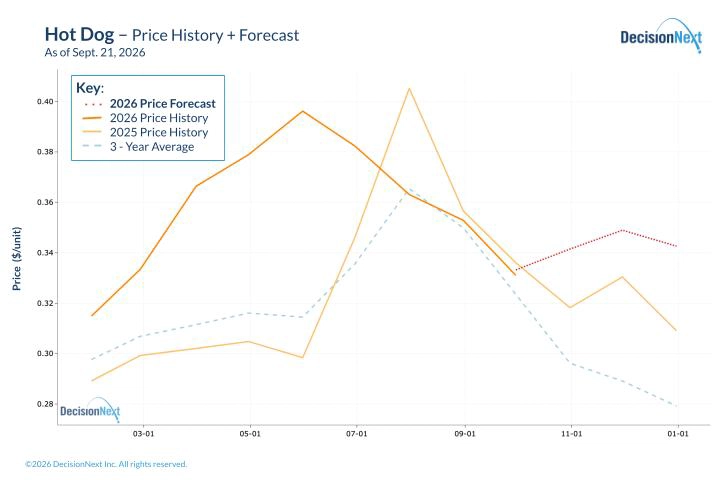
Figure 3 – Hot dog costs are forecast to firm through November after their post-summer decline.
Breaded Chicken Sandwich Index
The Breaded Chicken Sandwich Index is forecast near 79 in September, representing a raw-material cost of $0.62 per sandwich. That is about 7% below September 2025 and more than 20% below the 2025 average.
Further declines are expected during the fourth quarter. The index is forecast to fall to approximately 73 in October and 68 in November, bringing estimated raw-material costs down to roughly $0.53 per sandwich. A modest rebound is projected for December, but the index is still expected to finish the year near 71—well below the 2025 baseline but on par with values from last December..
Chicken remains the dominant driver. The chicken component is forecast to decline by approximately 18% from its mid-September level by December, while wheat and oil costs also ease modestly. Together, those movements reinforce the cost advantage developing for chicken relative to beef- and pork-linked finished goods.
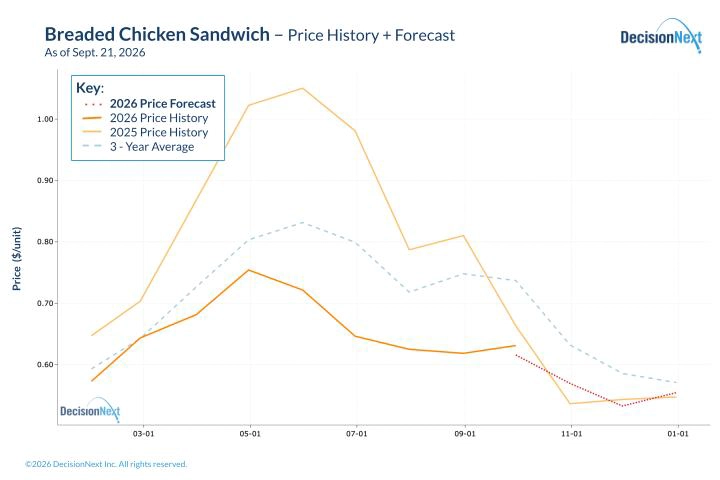
Figure 4 – Falling chicken breast costs are projected to push the Chicken Sandwich Index lower through November.
The Fourth-Quarter Protein Cost Gap Is Taking Shape
September marks a transition from the broad summer cost cycle to a more differentiated fourth-quarter outlook.
By November, the Cheeseburger Index is forecast near 105 and the Hot Dog Index near 107, while the Breaded Chicken Sandwich Index is projected near 68. That spread could give buyers and operators more flexibility to feature chicken, recover margin, or shift promotional activity toward poultry-based items. At the same time, the expected rise in hot dog costs underscores why seasonal assumptions alone may not be sufficient for purchasing and pricing decisions.
The larger takeaway is that changes within each finished-good basket matter as much as the headline direction of the protein complex. Forecasting the individual ingredients—and then rolling them into the finished item—helps reveal where apparently similar products may face very different cost and margin conditions.
Want to see the data behind these forecasts or run your own analysis? Connect with DecisionNext to review specific scenarios and see the forecasts for individual price series.
About the Report
The DecisionNext Finished Goods Index showcases multi-commodity finished-goods cost forecasting across protein, dairy, grain, and ingredient markets. See the full Finished Goods Index methodology.
By comparing current values with average prices from 2025, the index helps stakeholders visualize current and forward cost pressures and profit opportunities across value-added food products. The DecisionNext platform enables users to forecast finished-good costs, adjust recipes, and analyze forward-looking scenarios. Contact us for more information.