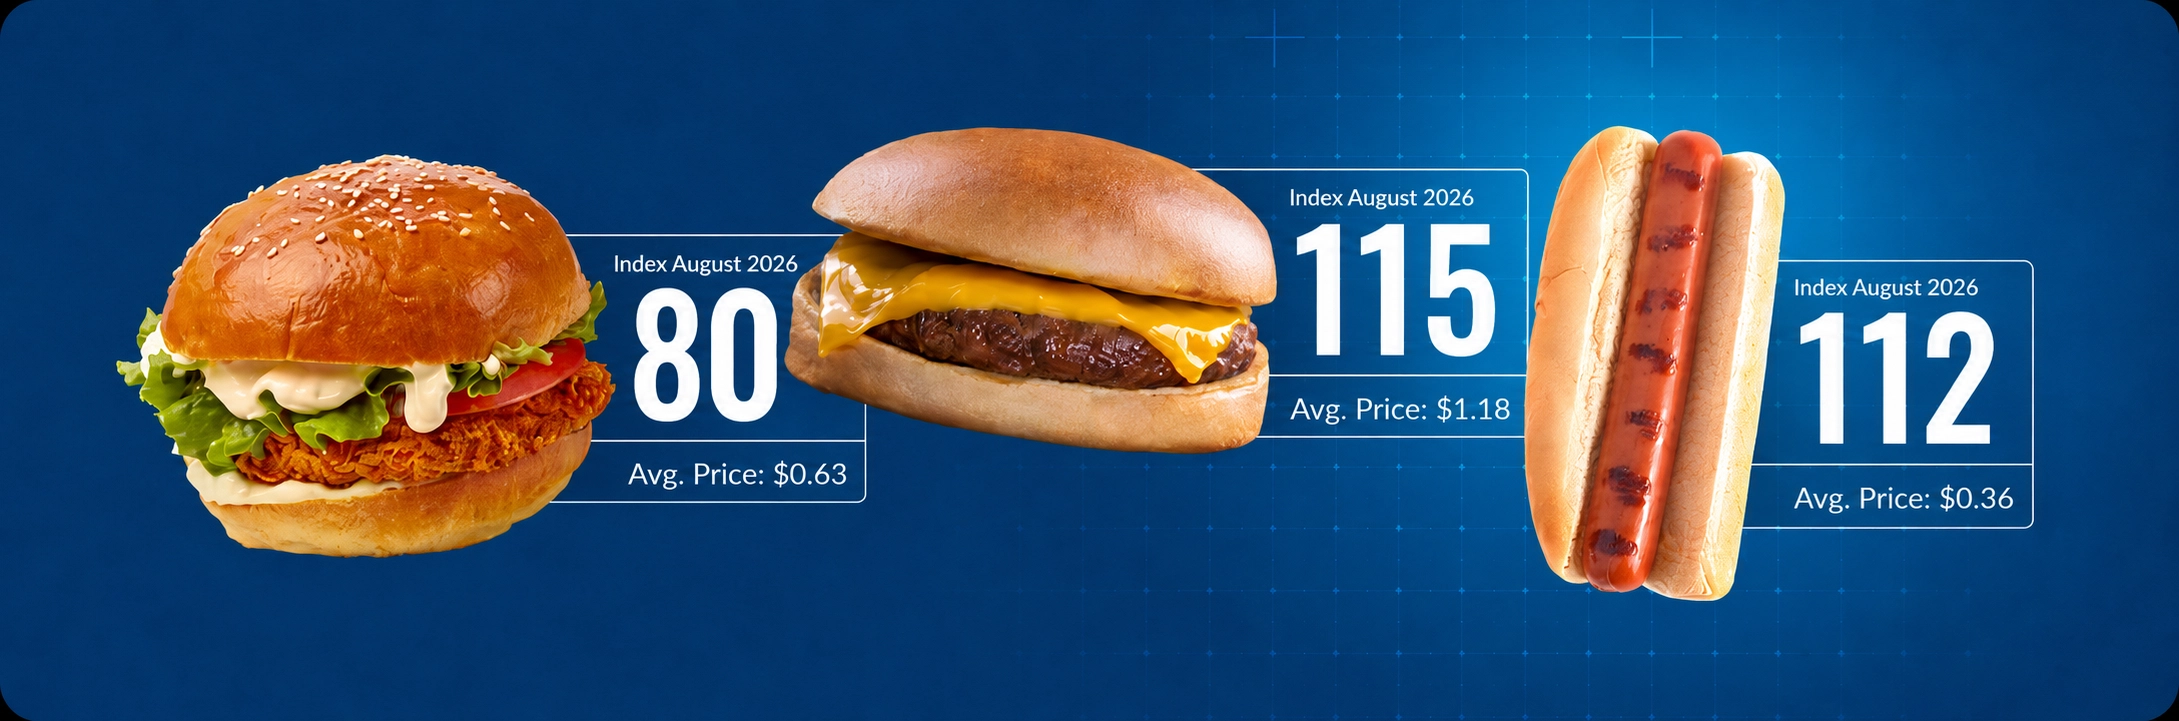
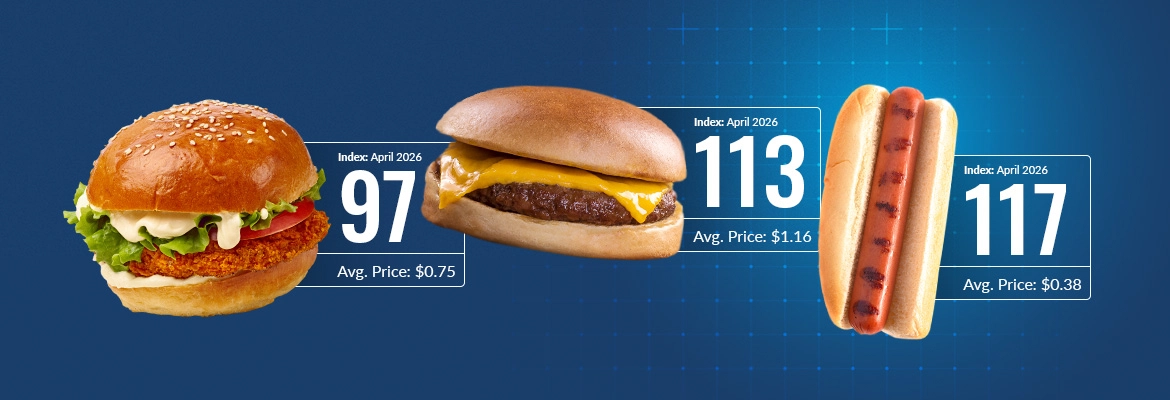
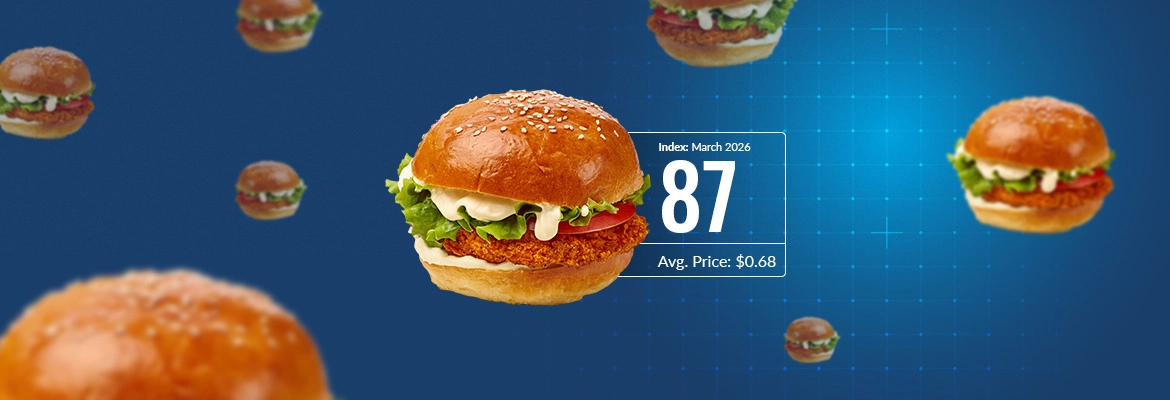
The DecisionNext Finished Goods Index Report | July 2026
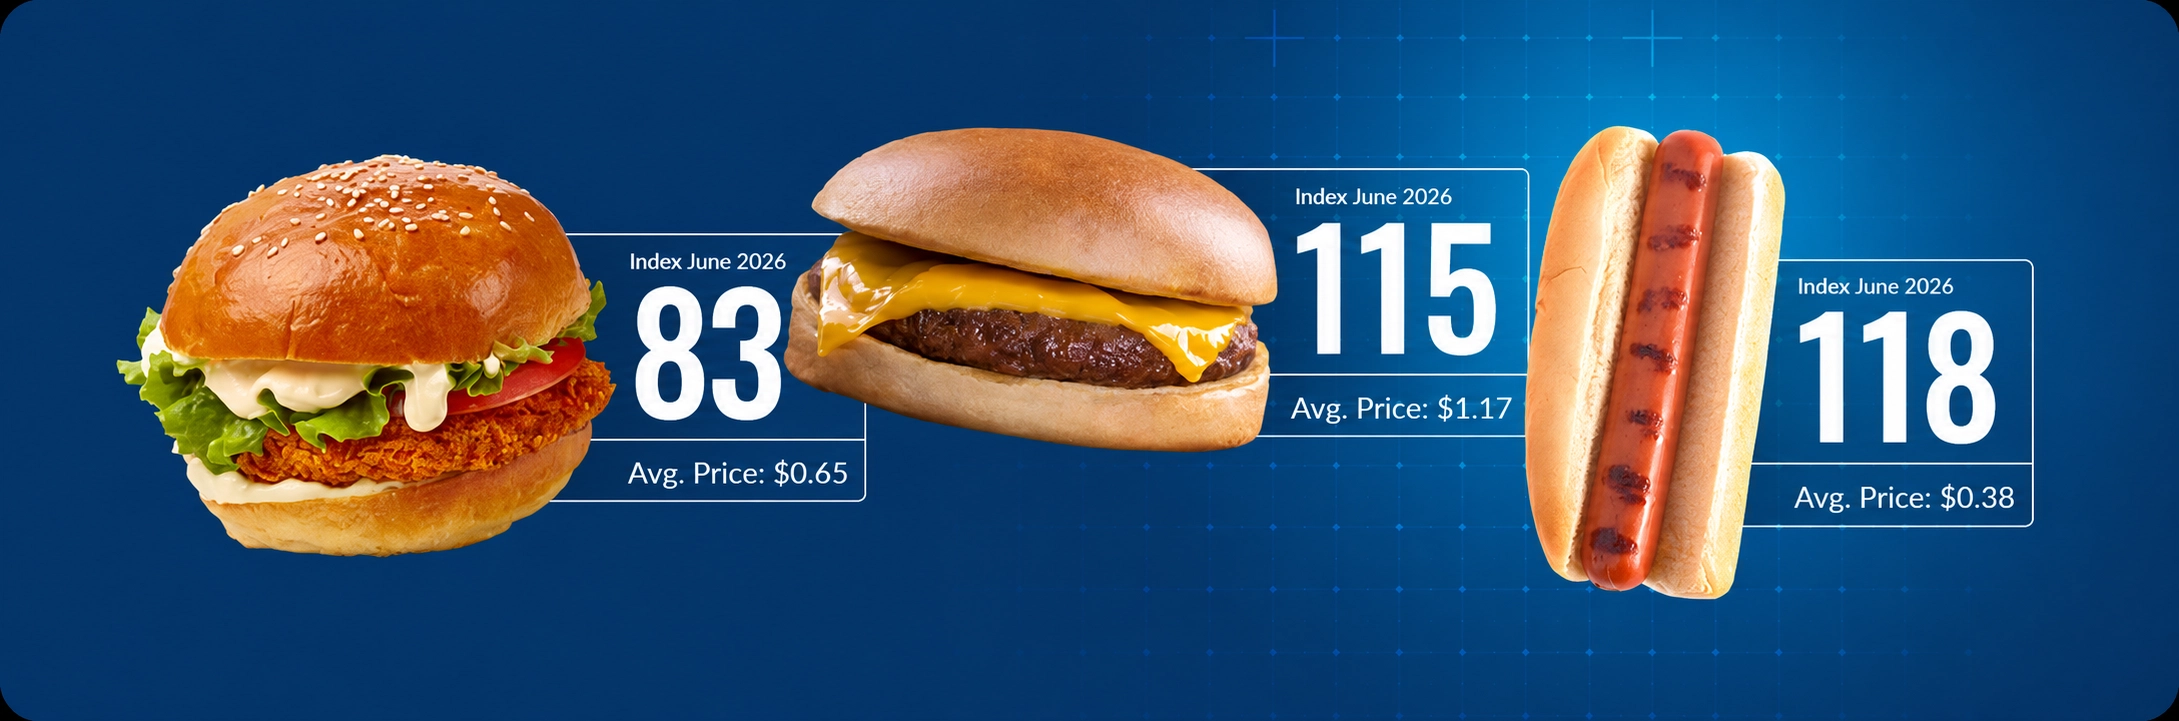
Published: July 15, 2026
Continued Divergence Across the Protein Complex
The July DecisionNext Finished Goods Index shows a widening divide across beef, pork, and poultry.
Cheeseburger costs remain near record levels as elevated lean-beef prices limit post-summer relief. Hot dog costs have eased from their spring peak but remain above the 2025 baseline. Meanwhile, chicken sandwich costs are down, driven largely by the price of chicken breast which is forecasted to continue sliding through the back half of the year.
For procurement teams, retailers, and foodservice operators, these trends create different pricing, promotional, and margin environments across the protein complex.
Key Insights
- Cheeseburger costs remain near record levels, with the July price forecast at $1.19 per serving and little relief expected through January.
- Hot dog costs are easing from their spring peak but remain above the 2025 baseline, with modest renewed pressure forecast for the fall.
- Chicken sandwich costs are falling sharply, with declining breast prices projected to push the index from 78.5 in July to approximately 60 by November.
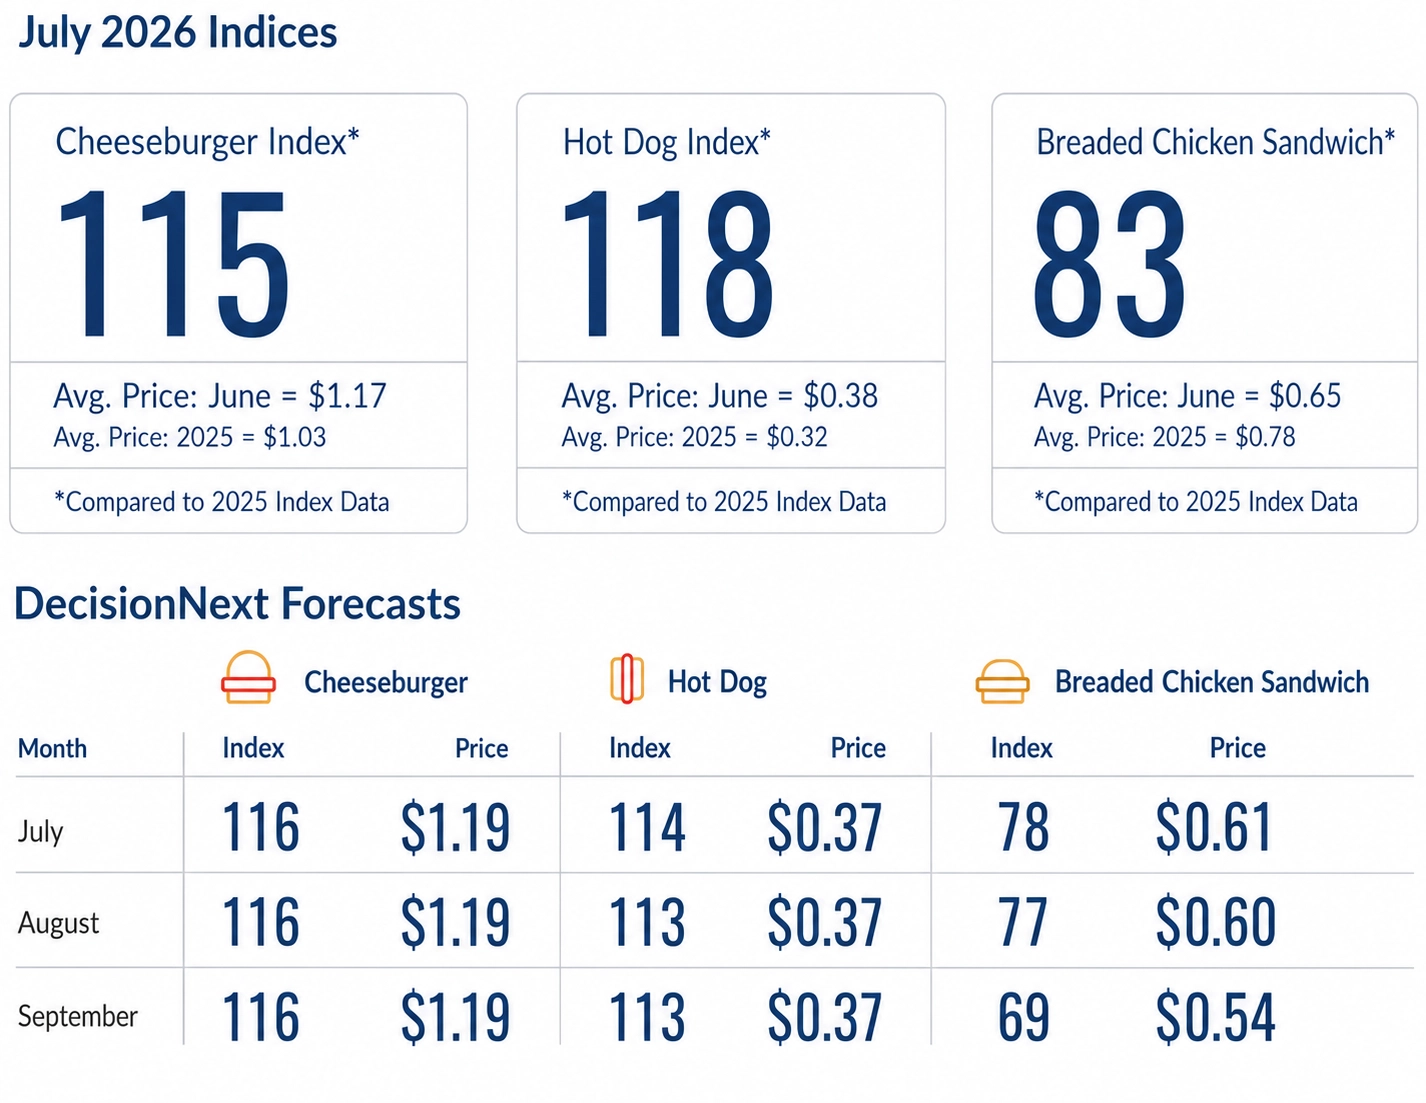
Figure 1 – July 2026 index values and DecisionNext forecasts through September 2027.
Cheeseburger Index
The Cheeseburger Index is forecast to reach 115.6 in July, representing a raw-material cost of approximately $1.19 per serving. That is 2.6% above July 2025.
The forecast shows little post-summer relief, with costs remaining near $1.18 to $1.19 through January. Persistently elevated 90% lean-trim prices are the primary driver. Although 50% lean trim is forecast to decline, that relief is partially offset by continued strength in 90s and higher cheese prices into the fall.
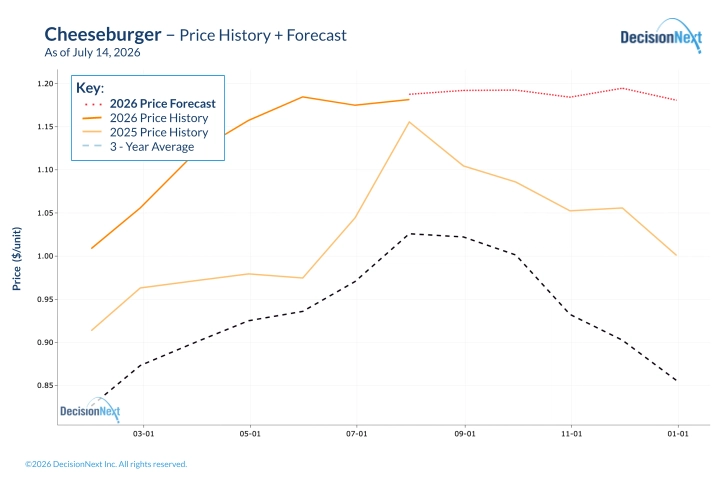
Figure 2 – Cheeseburger costs are forecast to remain near record levels through January.
Hot Dog Index
The Hot Dog Index peaked at 122.0 in May before falling to 117.7 in June (link to May FGI report). It is forecast to decline further to 113.8 in July, equivalent to approximately $0.37 per serving.
That remains below July 2025’s $0.41 peak but well above the 2025 average. Costs are forecast to remain near $0.37 through October before briefly rising to $0.38 in November.
The ingredient outlook is mixed. Higher pork, oil, and casing costs create modest upward pressure, while declining beef and wheat costs provide some relief in the late Fall and early Winter.
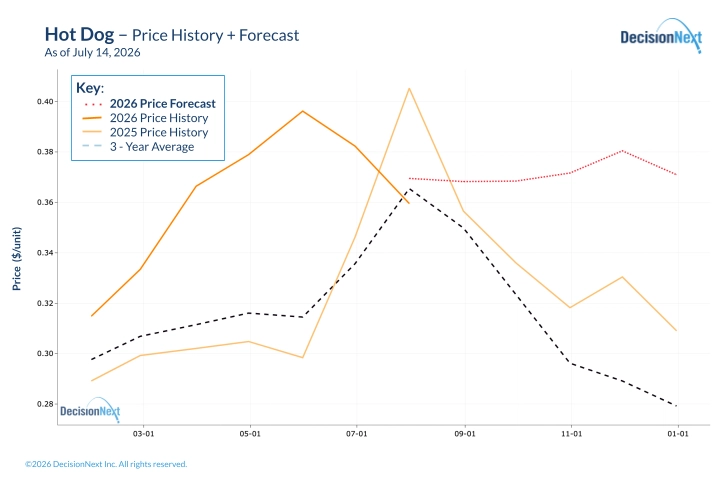
Figure 3 – Hot dog costs have eased from their spring peak but remain elevated relative to the 2025 baseline.
Chicken Sandwich Index
The Chicken Sandwich Index is forecast to reach 78.5 in July, representing a raw-material cost of approximately $0.61 per sandwich. That is about 22% below July 2025.
The index is projected to fall further through the fall, projected to fall as low as 60 in November, with costs declining to about $0.47 per sandwich.
Chicken breast is driving the correction. Boneless, skinless breast prices are forecast to fall from approximately $1.23 per pound in July to $0.79 by November. Lower wheat prices add further downward pressure, while modestly higher oil costs provide only a limited offset.
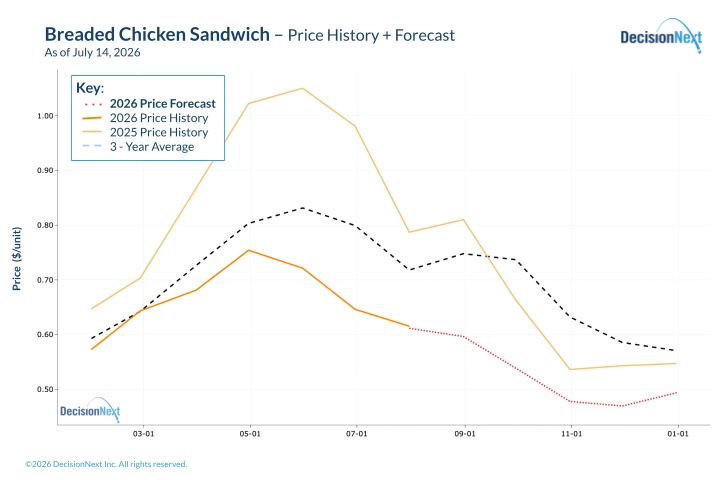
Figure 4 – Falling chicken breast prices are projected to push sandwich costs sharply lower through November.
The Post-Summer Cost Gap Is Widening
By November, the Cheeseburger and Hot Dog indexes are forecast at approximately 116 and 117, respectively. The Chicken Sandwich Index is projected near 60.
That widening gap could create significantly more room for chicken promotions and margin recovery, while elevated lean-beef costs continue to constrain burger economics. Hot dogs occupy the middle ground—below last summer’s peak, but still operating in an elevated cost environment.
The July outlook reinforces that protein inflation is no longer moving uniformly. Beef, pork, and poultry are following increasingly different cost trajectories, creating distinct risks and opportunities for buyers and sellers.
Want to see the data behind these forecasts or run your own analysis? Connect with DecisionNext or access the platform today.
About the Report
The DecisionNext Finished Goods Index showcases multi-commodity finished-goods cost forecasting across protein, dairy, grain, and ingredient markets. See the full Finished Goods Index methodology.
By comparing current values with average prices from 2025, the index helps stakeholders visualize current and forward cost pressures and profit opportunities across value-added food products. The platform enables users to forecast finished-good costs, adjust recipes, and analyze forward-looking scenarios.