The DecisionNext Finished Goods Index Report | October 2026
Published: October 22, 2026
The Post-Summer Reset Deepens—But Every Basket Points Higher Into Winter
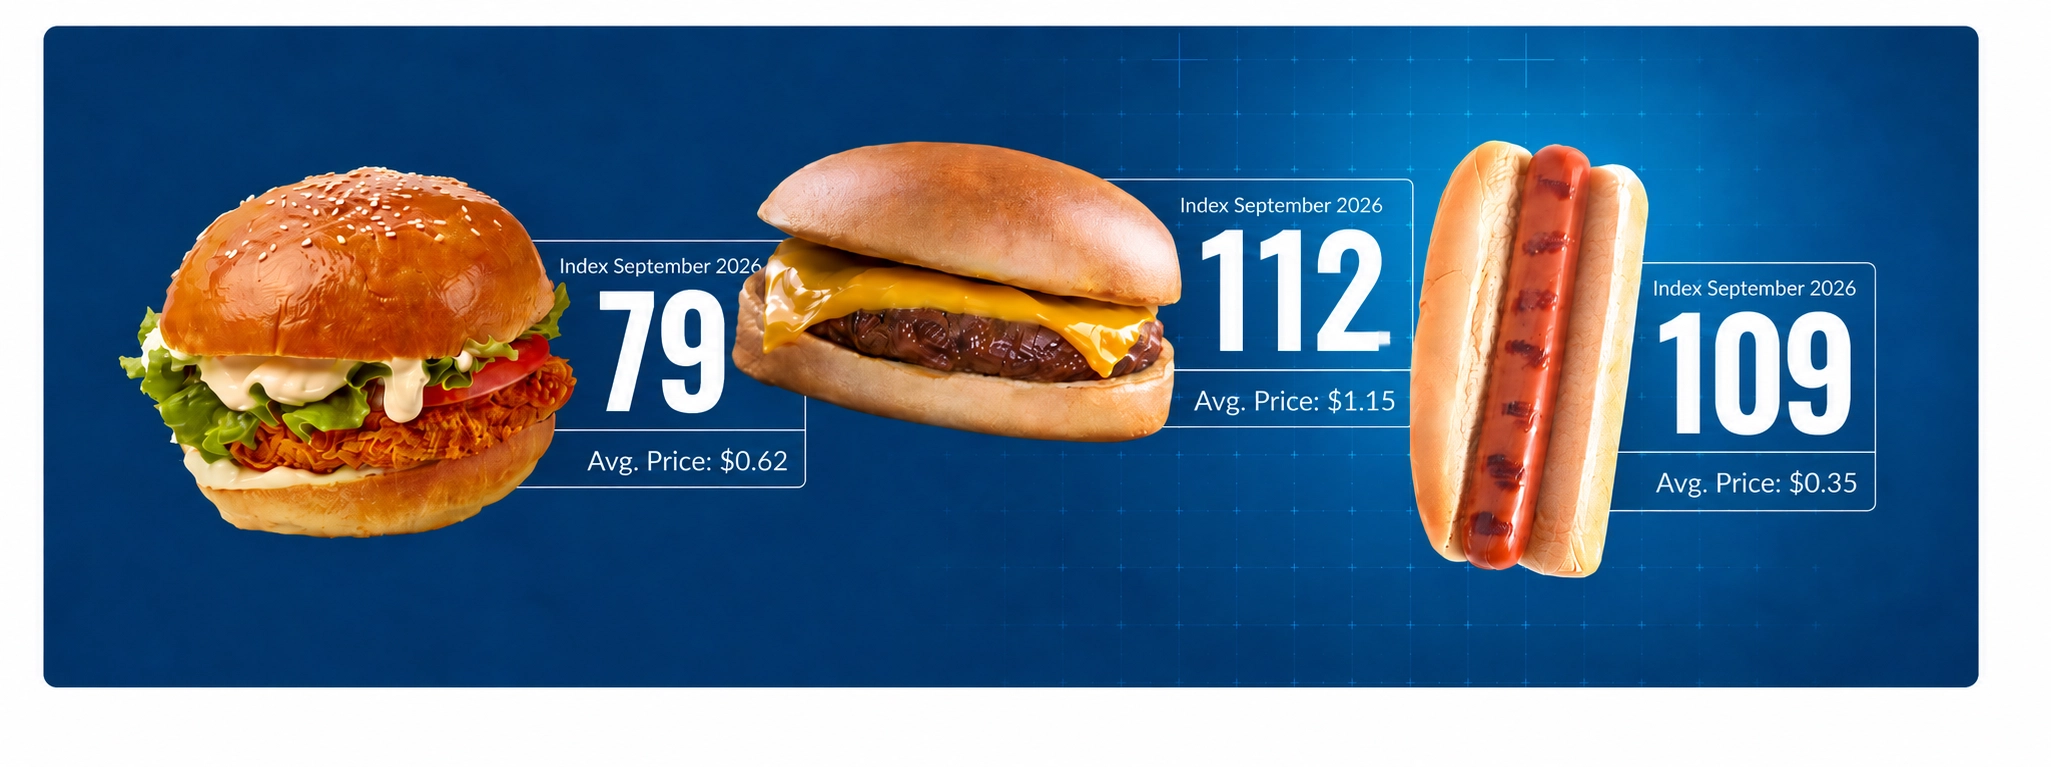
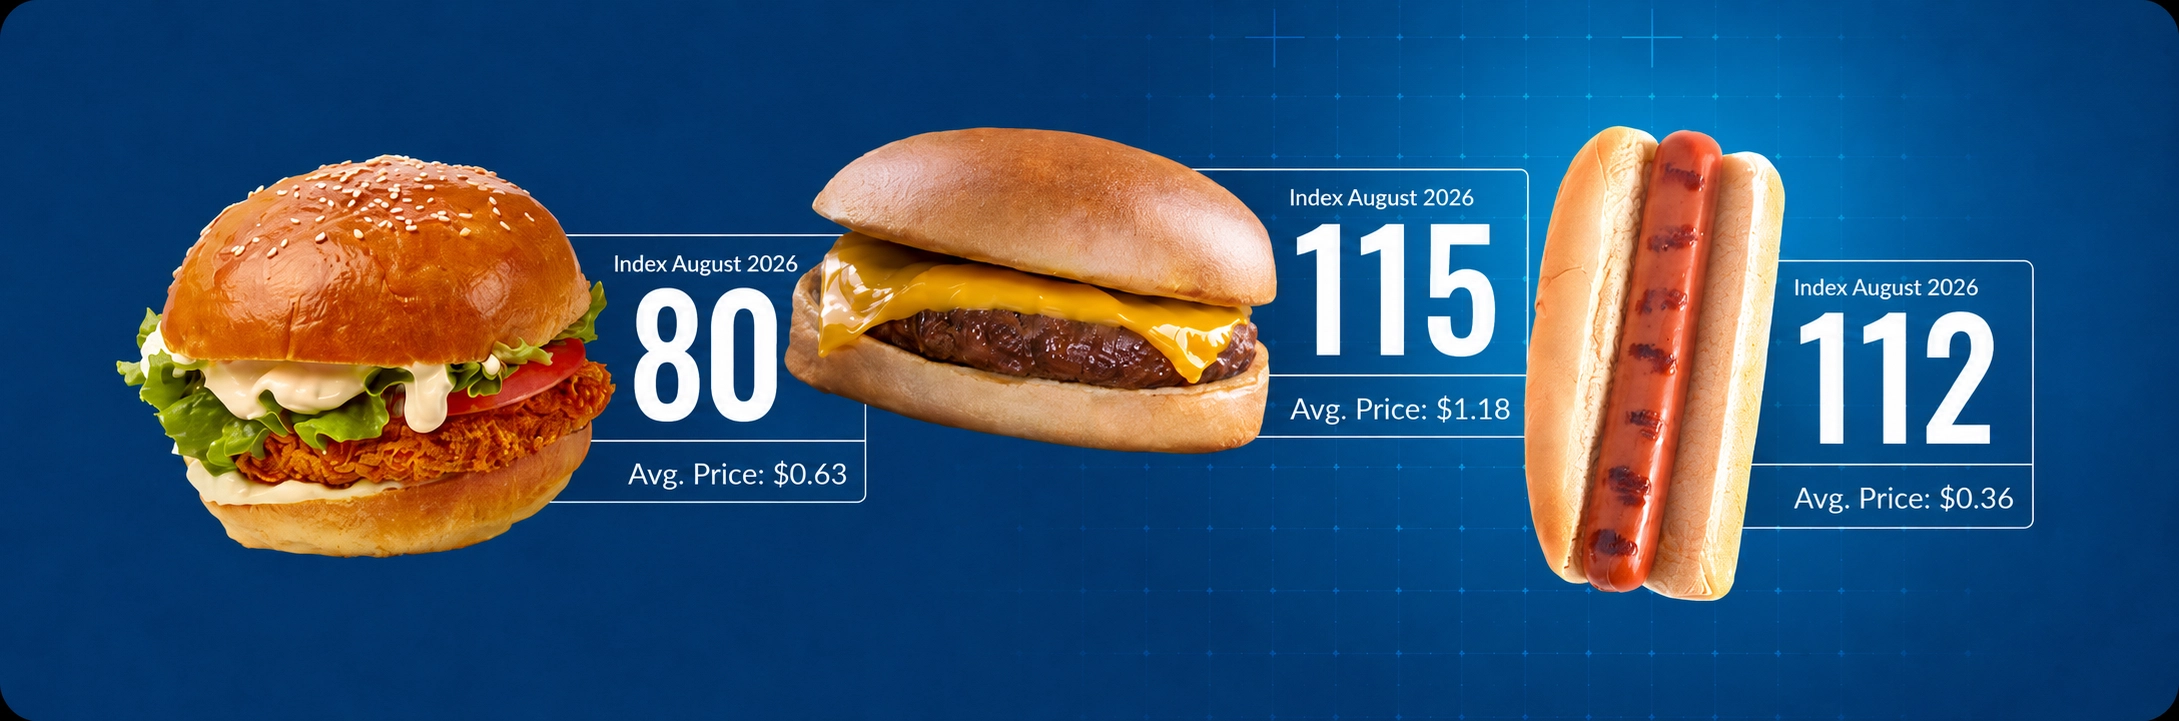
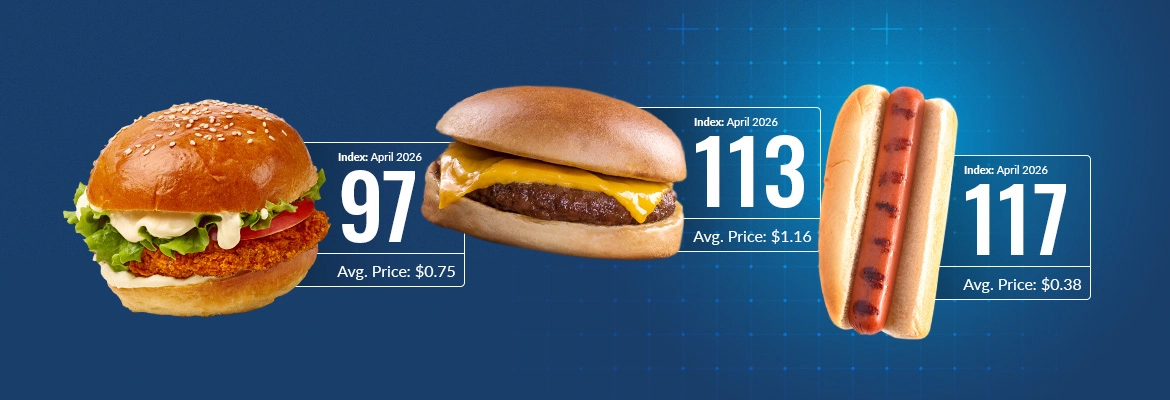
The October DecisionNext Finished Goods Index shows the post-summer cost reset continuing into the fall. In September, the Cheeseburger and Hot Dog Indices fell sharply from August and slipped below their year-ago levels. Meanwhile, the Breaded Chicken Sandwich Index edged higher for the first time since April.
Looking ahead, the latest DecisionNext forecasts point the same direction for all three baskets. Costs are expected to stay near current levels through November and then climb through the winter and into spring. After several months of protein costs moving in different directions, the outlook is converging on a shared upward path, though the gaps between the baskets remain wide.
For procurement teams, retailers, and foodservice operators, the fall may be the low point in raw-material costs for the next several months. That makes it a useful moment to review forward coverage, pricing, and promotional plans.
Key Insights
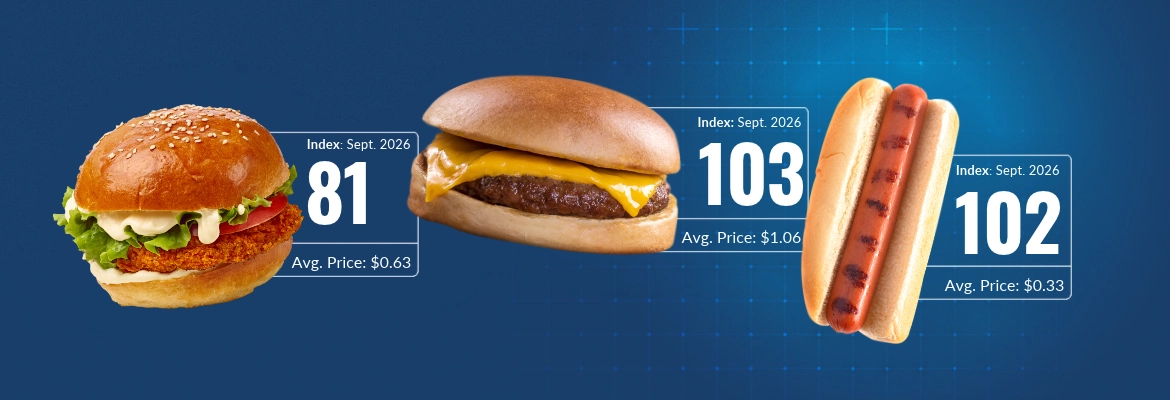
- The Cheeseburger Index fell from 112 in August to 103 in September. It is forecast to rise to 104 by January.
- The Hot Dog Index fell from 109 in August to 102 in September. It is forecast to firm to about 104 by January.
- The Breaded Chicken Sandwich Index edged up to 81 in September. It remains about 19% below the 2025 average.
- Wheat prices are up about 69% from a year ago, raising bun costs for all three items.
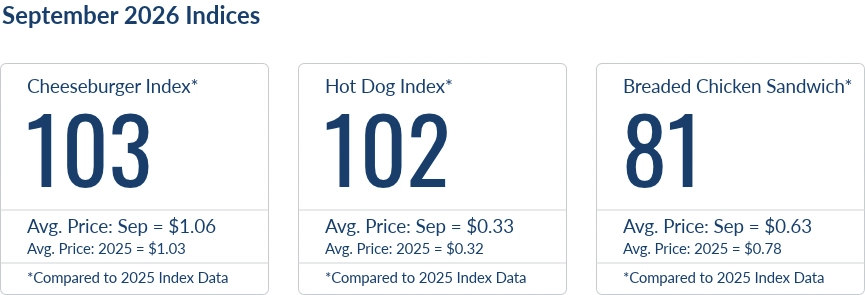
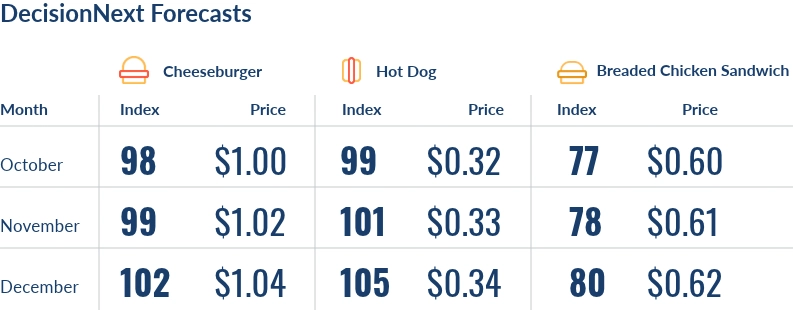
Figure 1 – September 2026 index values and DecisionNext forecasts for October through December.
Cheeseburger Index
The Cheeseburger Index averaged 103 in September, representing a raw-material cost of approximately $1.06 per serving (Fig. 2). That is down from about 112 in August and about 3% below September 2025, but still slightly above the 2025 average of $1.03.
Beef inputs drove the decline. Fresh 50% lean trim averaged about $0.92 per pound in September, down from $1.44 in August, and fresh 90% lean trim eased about 6% to roughly $4.26 per pound. Cheese also softened, with CME barrels down about 5% to $1.48 per pound, while higher wheat prices partly offset the decline through bun costs.
For broader context, our U.S. lean-trim analysis finds that domestic fresh 90% lean prices are shaped largely by U.S. cow supply and seasonality, while imported trim is not a one-for-one substitute.
The index is forecast to rebound to 104 in January, with raw-material costs rising from about $1.02 to $1.07 per serving. Further out, the forecast continues to strengthen into the spring, reaching about 112 by April 2027. Lean trim is the main source of upward pressure: fresh 50% lean is forecast to recover to about $1.11 per pound in November and above $1.30 in January, while wheat and oil are forecast to ease.
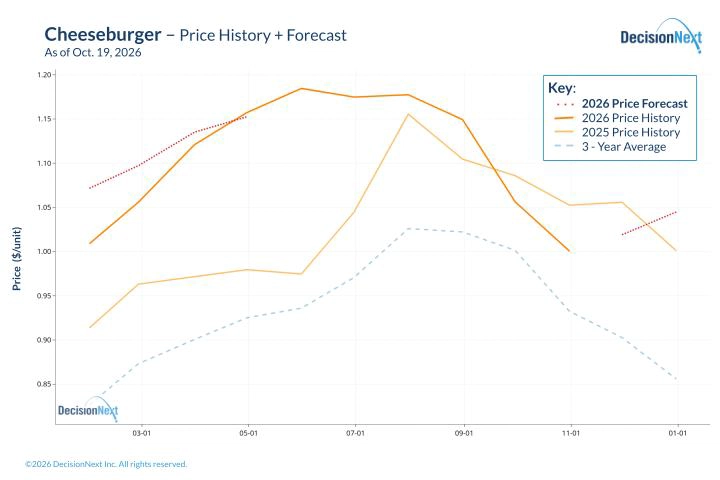
Figure 2 – Cheeseburger raw-material costs dropped in September and are forecast to rebuild through the winter.
Hot Dog Index
The Hot Dog Index averaged 102 in September, representing a raw-material cost of approximately $0.33 per serving (Fig. 3). That is down from about 109 in August and about 1% below September 2025.
Sausage and pork inputs eased in September, with the sausage component down about 23% and the pork component down about 3% from August. Those declines were partly offset by higher costs for nonfat dry milk, soybean meal and wheat.
The index is forecast to hold near current levels in November before firming through the winter, reaching about 104 in January, with raw-material costs edging up to about $0.34 per serving. Further out, the forecast continues to strengthen into the spring, peaking above 110 in March 2027. Beef and sausage inputs are the main sources of upward pressure: the beef component is forecast to rise roughly 40% from its September level by January. Last month’s report forecast the index near 107 in November, but the latest forecast places November near 101. The expected counter-seasonal firming is now arriving later and more gradually.
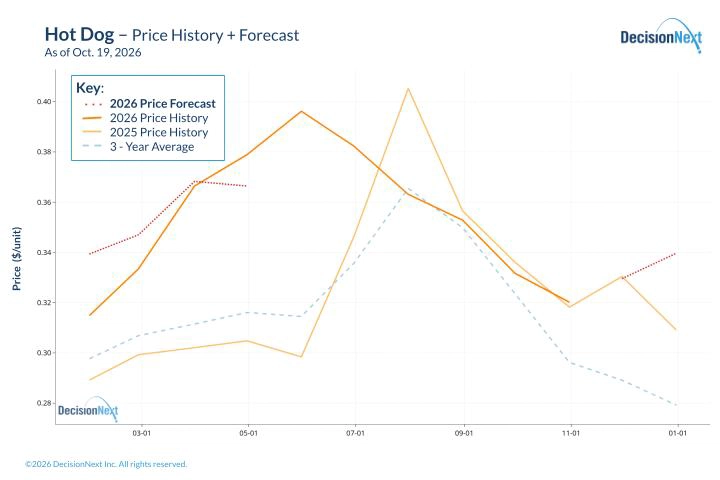
Figure 3 – Hot dog costs are forecast to hold near current levels in November before firming into winter.
Breaded Chicken Sandwich Index
The Breaded Chicken Sandwich Index rose to 81 in September, representing a raw-material cost of approximately $0.63 per sandwich (Fig. 4). That is up from about 79 in August, its first monthly increase since April. It remains about 5% below September 2025 and roughly 19% below the 2025 average of $0.78.
Chicken breast prices held steady at about $1.22 per pound in September, still about 21% below a year earlier. Higher wheat prices added modestly to bun and breading costs.
The steep decline projected last month is no longer in the forecast. The September report projected the index near 68 in November; the latest forecast places November near 78. From there, the index is forecast to recover gradually to 82 in January, with raw-material costs rising to about $0.64 per sandwich. Further out, the forecast continues to strengthen into the spring, reaching around 90 by April 2027. Chicken breast is the main driver, forecast to climb above $1.30 per pound by January.
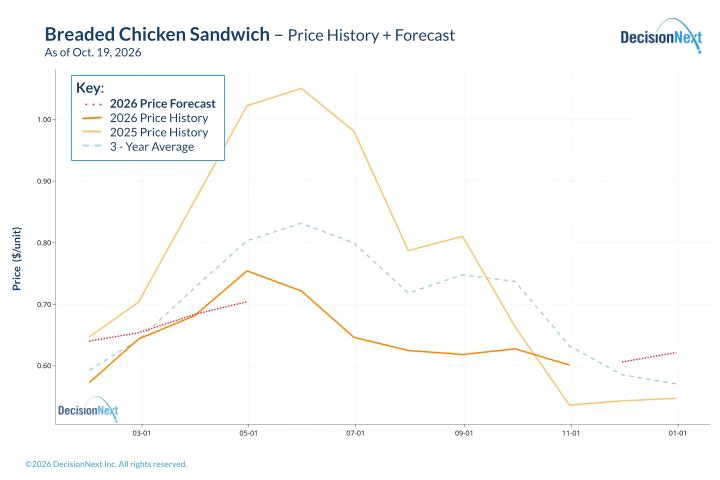
Figure 4 – Chicken sandwich costs are forecast to bottom out this fall and recover gradually into 2027.
From Divergence to a Shared Winter Rebound
For much of 2026, the Finished Goods Index has told a story of divergence across protein sectors, with beef, pork and chicken following separate cost paths. October’s outlook is different: all three baskets are forecast to move higher from their fall levels.
The gaps between the baskets have not closed. In January, the Cheeseburger and Hot Dog Indices are both forecast near 104, while the Breaded Chicken Sandwich Index is projected near 82. Chicken therefore remains the lower-cost protein, but the further declines expected last month have faded from the outlook. Meanwhile, the beef-linked baskets are forecast to give back their fall relief over the winter.
The larger takeaway is that the fall may represent a near-term low in finished-good costs. Forecasting each ingredient and rolling it into the finished item helps show how much of that low is driven by temporary moves in inputs such as lean trim, and how quickly those moves are expected to reverse.
Want to see the data behind these forecasts or run your own analysis? Connect with DecisionNext to review specific scenarios and see the forecasts for individual price series.
About the Report
The DecisionNext Finished Goods Index showcases multi-commodity finished-goods cost forecasting across protein, dairy, grain, and ingredient markets. See the full Finished Goods Index methodology.
By comparing current values with average prices from 2025, the index helps stakeholders visualize current and forward cost pressures and profit opportunities across value-added food products. The DecisionNext platform enables users to forecast finished-good costs, adjust recipes, and analyze forward-looking scenarios. Contact us for more information.